2026 results · Tennessee · Tennessee Governor
Marsha Blackburn, the Republican, holds Tennessee's governorship for the Republicans
Donald Trump carried Tennessee by 29.7 points in 2024; this year's count is a 27.2-point move toward the Democrats.
| Candidate | Votes | Share | Share of the vote |
|---|---|---|---|
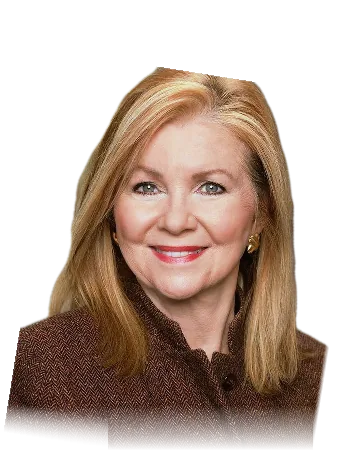 Marsha BlackburnRepublican | 955,298 | 45.5% | |
 Jerri GreenDemocrat | 902,615 | 43.0% | |
| David HatleyIndependent | 195,288 | 9.3% | |
| Lauren PinkstonIndependent | 26,186 | 1.3% | |
| 11 others | 21,876 | 1.0% |
Called by Call the Map, Nov 4, 10:46 AM EST · 96% counted.
About 96% of the expected vote counted2,101,263 votesCount last changed Nov 7, 4:57 PM EST · checked Nov 7, 5:11 PM ESTSource: the official state and county counts, gathered by civicAPI
The map
Loading the map.
What moved most
Scroll through Tennessee, part by part. The parts follow the federal government’s metropolitan areas: each big metro’s core counties, its suburbs and outer suburbs, the smaller metro areas, then the small towns and countryside.
What the count shows
Added together, the 95 counties compared moved 27.2 points toward the Democrats from the 2024 presidential vote.
The counties compared cast 69% as many votes as in 2024, from 78% in Shelby County to 44% in Overton County. Where turnout ran higher, the county moved more toward the Republicans (r = −0.72).
Marsha Blackburn won with 45.5% of the vote, short of half
- Marsha Blackburn, Republican955,29845.5%
- Jerri Green, Democrat902,61543.0%
- David Hatley, Independent195,2889.3%
54.5% voted for someone else. The line marks half the vote.
Warren County moved most: R+56.1 for president in 2024, R+18.7 this year
The 10 counties with the largest moves from the 2024 presidential vote, among those with 2,000 or more votes for president in 2024 and a quarter of that counted, and at least half a percent of the state's 2024 vote. Each line runs from the 2024 margin to this year’s.
2024 president 2026
Knox County added 52,815 net votes for Green against the 2024 margin, 6% of the statewide change
Across the 95 counties compared, the margin moved by 857,917 votes toward Green: this year’s lead in votes against the 2024 presidential lead in votes, county by county. The figure counts voters who changed sides and differences in who turned out alike; the count cannot tell them apart.
- Knox County+52,815 Green
- Rutherford County+40,986 Green
- Hamilton County+35,449 Green
- Davidson County+32,597 Green
- Williamson County+32,248 Green
- Sumner County+31,902 Green
- Sullivan County+28,760 Green
- Wilson County+25,677 Green
5 counties Donald Trump carried in 2024 are led by Green this year
Striped on the map above. Largest first.
- Knox CountyR+19.5D+6.1
- Hamilton CountyR+13.0D+10.1
- Rutherford CountyR+21.8D+8.7
- Montgomery CountyR+18.4D+6.5
- Madison CountyR+18.2D+3.3
What the places that moved have in common
Each of Tennessee’s counties, set against the Census Bureau’s figures for who lives there. A pattern across counties, not an exit poll: it does not say how any group of people voted.
Urban, suburban and rural counties
2024 president 2026 · Urban: 1,000 or more residents per square mile; suburban: 100 to 999; rural: under 100 (our grouping).
Census Bureau ACS 2019–2023 and 2023 Gazetteer; a county joins once its count is substantially in.
Tennessee’s ballot
StatewideRepublicans won all 2 of Tennessee's statewide races.
U.S. HouseBefore the election R 8–1, now R 8–1, counting the leaders in 2 uncalled seats
won leads, still counting changed party. Margins are the leader’s share minus the runner-up’s, in points.
Every count on this page is the official count, from the state and its counties. Counts are unofficial until the state certifies them. The 2024 comparison is the presidential vote, Kamala Harris against Donald Trump, on the same ground. Margins are the Democrat minus the Republican, in points of all votes. Photos: Marsha Blackburn, by United States Senate Photographic Studio, public domain, via Wikimedia Commons, cropped, background removed; Jerri Green, by Zach Kinslow, CC BY 4.0, via Wikimedia Commons, cropped, background removed.

