
The House Always Wins
A history of gerrymandering in 16 maps
From the district that was supposed to keep James Madison out of Congress to the one on your ballot on November 3.
The Texas House chamber in Austin, where the 2025 map passed 88 to 52. Photo: Carol M. Highsmith, Library of Congress. Public domain, via Wikimedia Commons.
In March 1812 a map of Essex County, Massachusetts, went around a dinner table on Summer Street in Boston. The legislature had just cut the county into two state senate districts, one curled around the other, and a guest said the outer one needed only wings to make a monster. An engraver at the table, Elkanah Tisdale, drew them. He threw in claws and teeth. Somebody offered “salamander,” and somebody else, thinking of Governor Elbridge Gerry, who had signed the bill, said “Gerry-mander.”
That is the story as it was pieced together eighty years later; the Library of Congress says the coiner has never been identified. The drawing is not in dispute. The Boston Gazette printed it on March 26, and Americans have hunted gerrymanders by Tisdale’s method ever since. Find the district that looks like an animal.
The method has a weakness, which is that the wings were Tisdale’s. In the two centuries since, some of the strangest districts in the country have been drawn to get a shut-out minority into Congress, and one of the most notorious lines of the last decade ran down the middle of an ordinary street. This is a history of the practice in sixteen maps. The last is on your ballot on November 3, and it can be measured in a way the other fifteen could not.
Essex County, March 1812: the map, and what was made of it
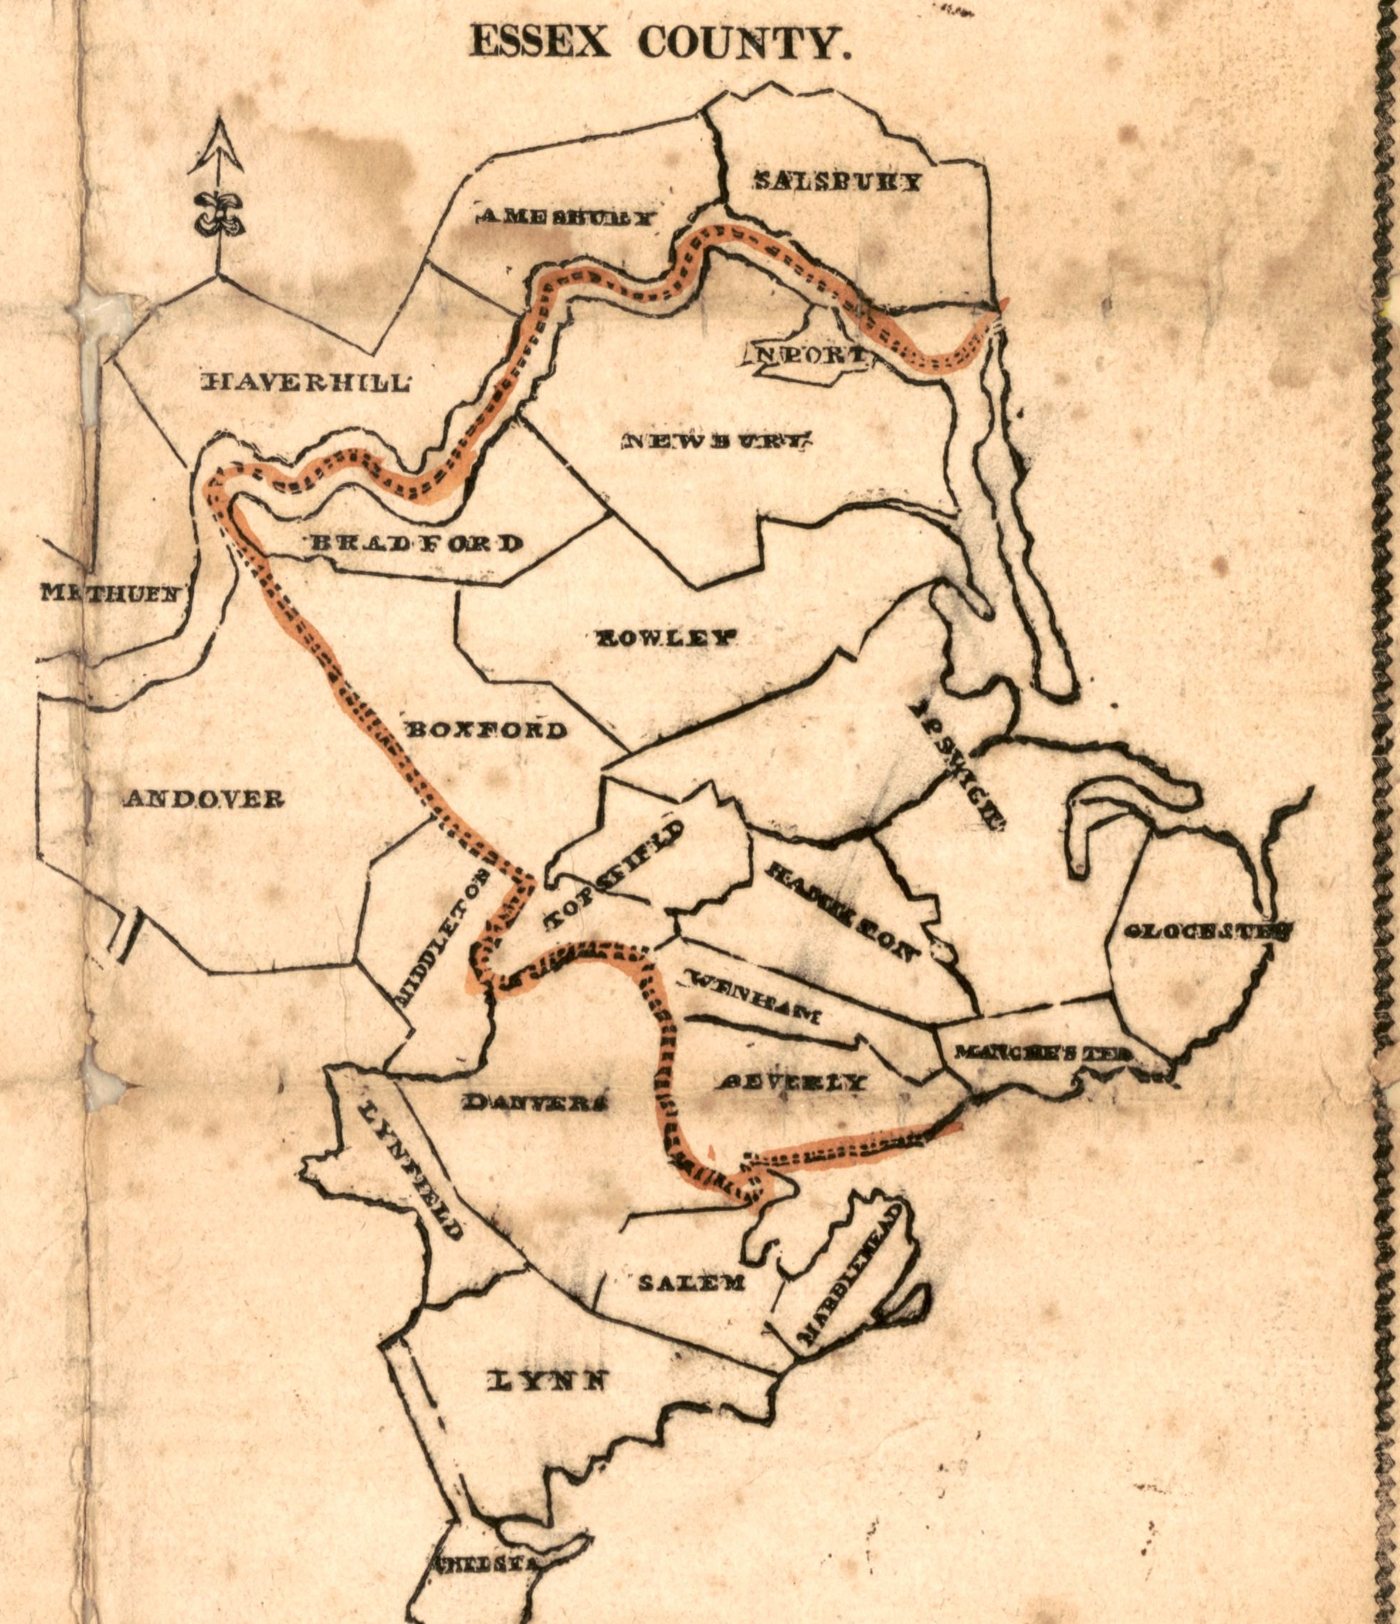
March 9The Gazette’s map of the county’s two new senate districts. The dotted line between them is colored on this copy; the outer district runs from Salisbury around to Chelsea.
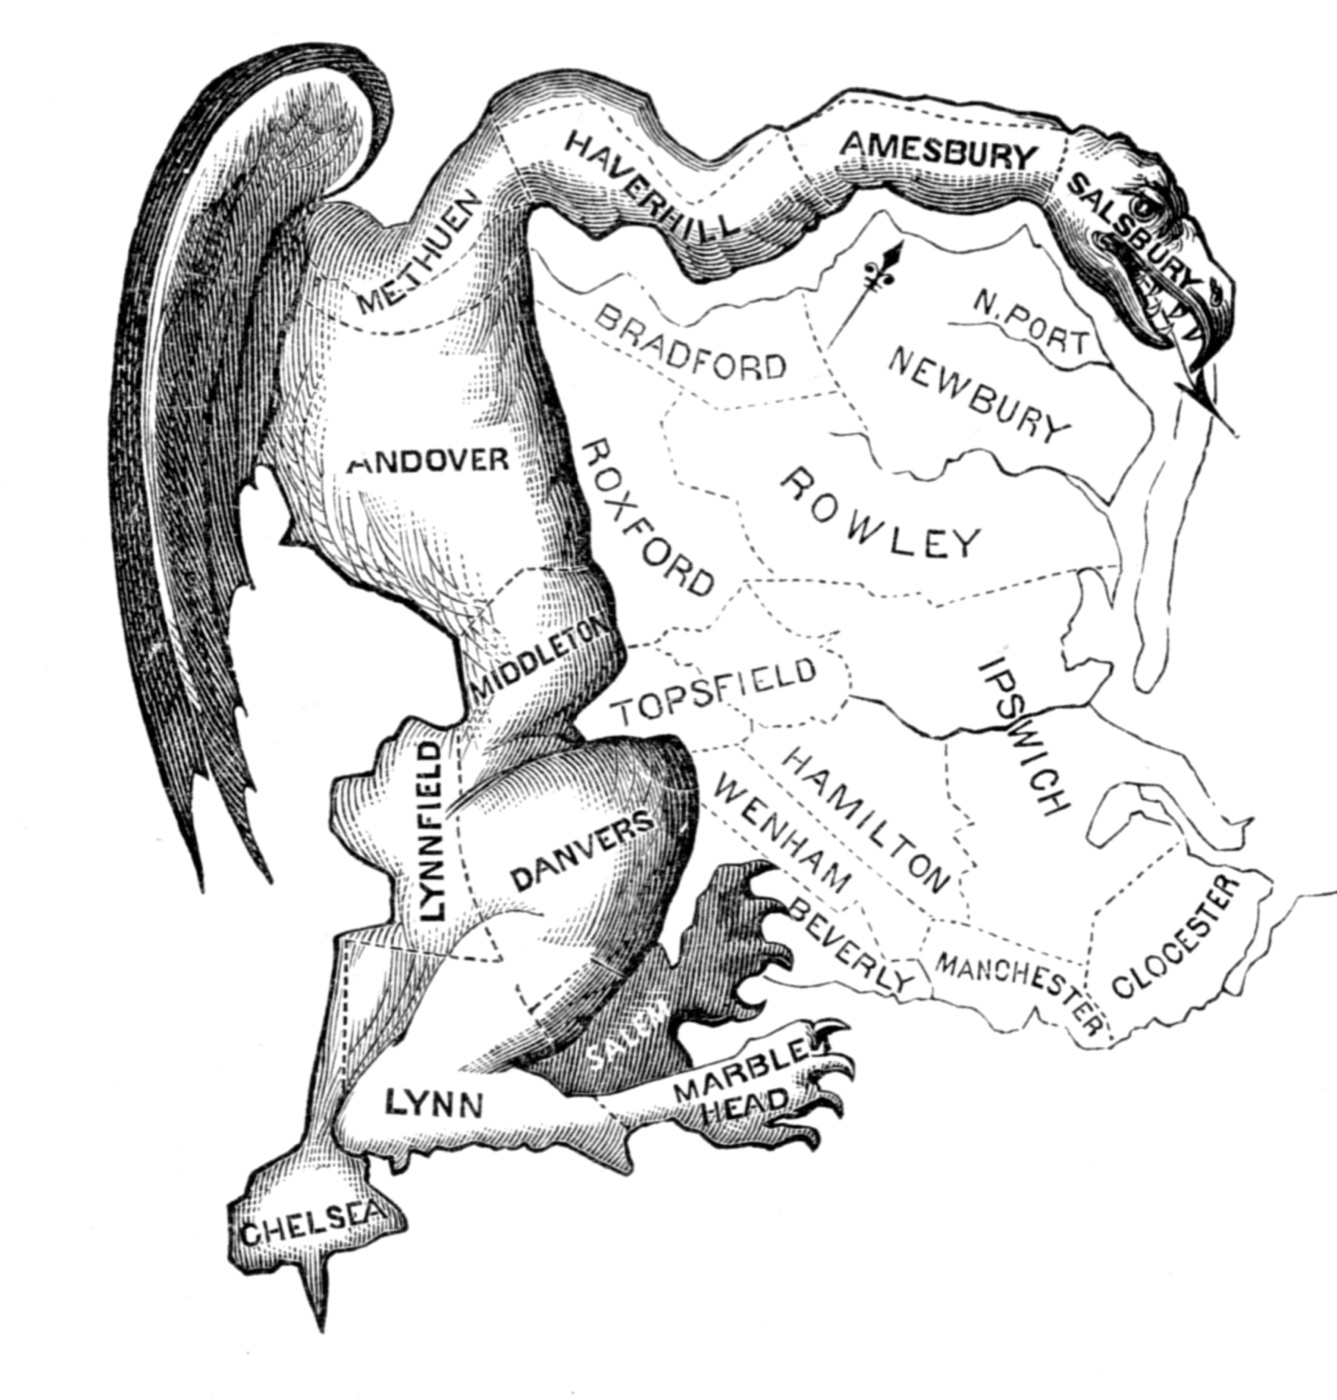
March 26The same district, seventeen days later.


IMonsters
1Virginia’s 5th District, 1788
The charge is twenty-four years older than the word. In the fall of 1788 Patrick Henry, who had lost the fight over the Constitution to James Madison that summer, ran the Virginia legislature so completely that, George Washington said, he had “only to say let this be Law” and it was. He had just kept Madison out of the Senate, warning that electing him would “terminate in producing rivulets of blood throughout the land.” Now there were House districts to draw, and Madison’s county, Orange, came out attached to seven others, of which one had voted to ratify. Thomas Jefferson, in Paris, wrote a friend that Henry had “so modelled the districts” that “Madison may not be elected into the lower federal house.”
Madison was in New York with hemorrhoids and no wish to travel. His friends insisted. He reached Orange after Christmas and spent January writing letters and standing in the cold, assuring a Baptist preacher that he now favored amendments protecting “the rights of Conscience in the fullest latitude.” On February 2, 1789, in ten inches of snow, he beat James Monroe by 336 votes. Four months later he stood up in the House and introduced the amendments. The Bill of Rights was, among other things, a campaign promise. No House race since has been fought between two future presidents.
The district has gone down as the first gerrymander, and in 2019 Chief Justice John Roberts began a history of the practice with it. It does not look the part. It was eight whole counties in a single block of the Piedmont, between the fall line and the Blue Ridge. The first scholar to test the charge, in 1907, found that “in shape and population it was normal.” A second, Thomas Rogers Hunter, concluded in 2011 that Virginia’s plan showed “no marks of partisan purpose” and that Madison’s trouble was his neighbors. Hunter’s article is the one the chief justice cited.
The committee that reported the districting bill had fifteen members. One was James Monroe.
Virginia’s 5th District, 1788
Eight whole counties, by Virginia’s act of November 20, 1788. Orange was Madison’s.
2Essex South, Massachusetts, 1812
Tisdale’s monster earned its name on arithmetic. In that April’s state senate election the Federalists outpolled Governor Gerry’s party by about 1,600 votes in 100,000 and won eleven seats to its twenty-nine.
Gerry had little to do with any of it. He probably did not write the plan. The Library of Congress says he found it “highly disagreeable.” He signed it, lost the governorship in the same election that kept his party the senate, and went into the dictionary. He pronounced the name with a hard G, as in Gary. Before the year was out he had been elected vice president of the United States, on the ticket of James Madison.
The Federalists won the senate back the next spring by the same score reversed, repealed the districts, and published the Gerry-mander’s obituary, illustrated with its skeleton. They were early.
3Ohio, 1890
Mid-decade redistricting, the novelty of 2025, was the routine of the 1880s. Between 1862 and 1896 there was a single election year in which no state redrew its congressional districts. Ohio redrew seven times in fourteen years and at one stretch held six consecutive elections on six different maps, a new one nearly every time the legislature changed hands.
The Democrats’ map of 1890, the New York Times reported, “has made more changes in the map of Ohio than have occurred in African geography in recent years.” That November Ohio’s Republicans outpolled its Democrats and won seven of twenty-one seats, down from sixteen. Among the casualties was the chairman of the Ways and Means Committee, William McKinley, who was running in a redrawn district with an unpopular tariff named after him. He went home to Canton, was elected governor the next year, and was elected president in 1896.
Ohio’s congressional districts, 1878 to 1892
Each map, with the elections held on it.
- 187820 districts
- 188020 districts
- 188221 districts
- 188421 districts
- 1886, 188821 districts
- 189021 districts
- 1892 to 190021 districts
4Tuskegee, Alabama, 1957
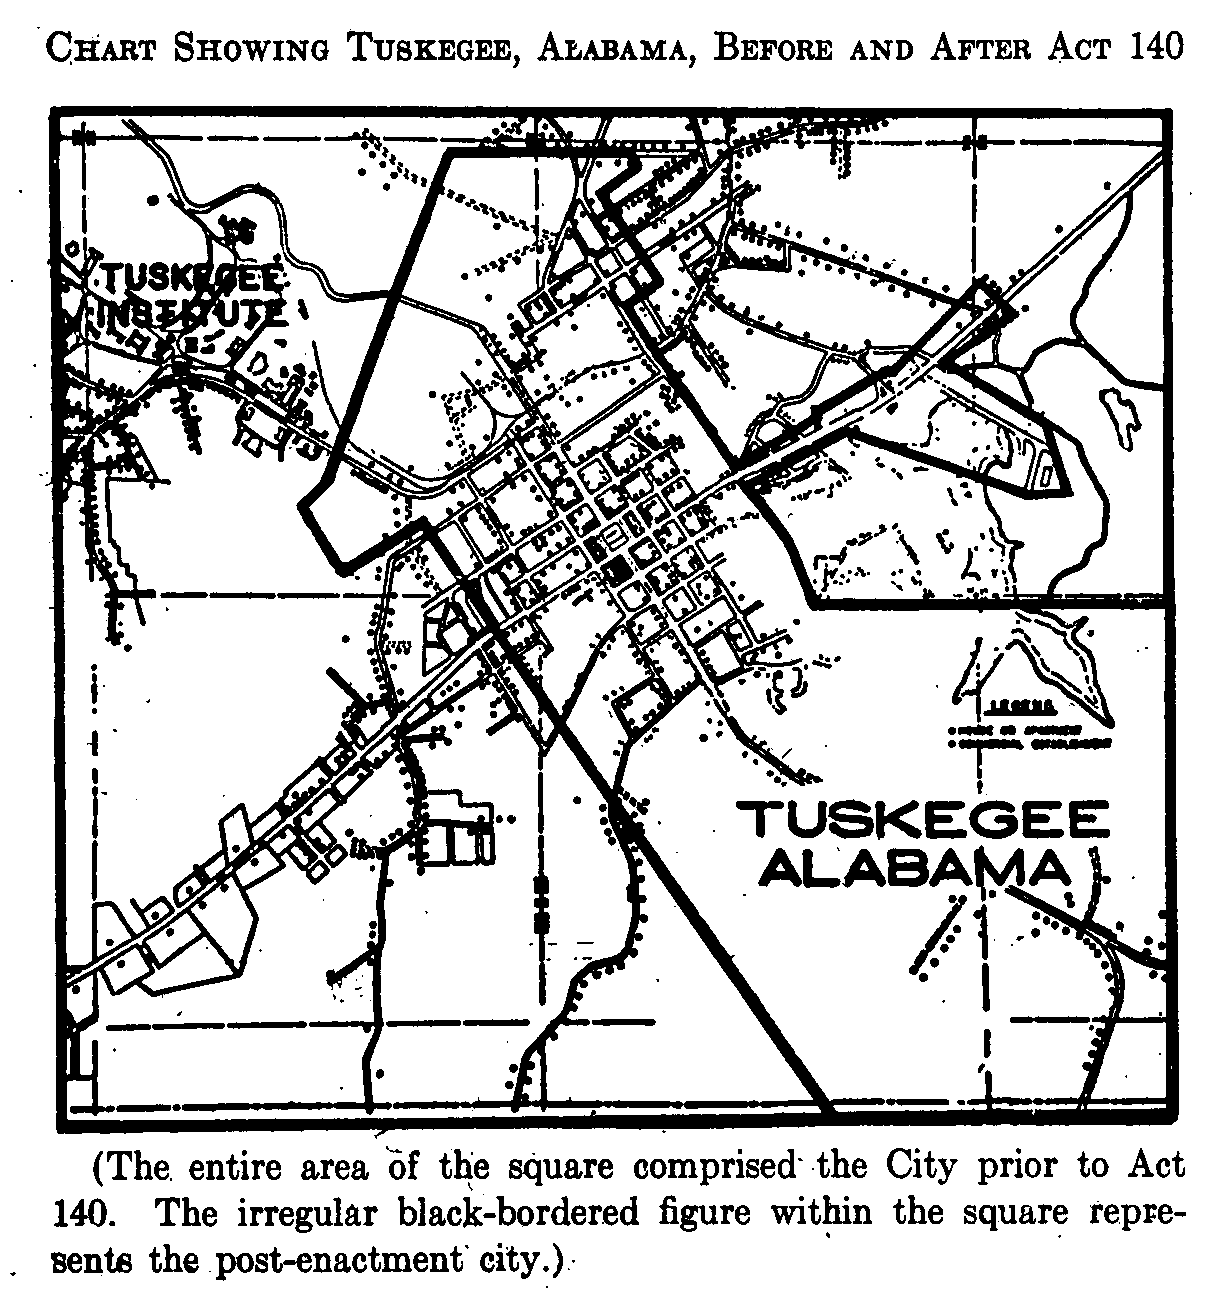
Once, the shape was the whole case. In 1957 the Alabama legislature redrew the city limits of Tuskegee, which had been a square, into what the Supreme Court would call “an uncouth twenty-eight-sided figure.” According to the Black residents who sued, the new boundary put outside the city all but four or five of its 400 Black voters and not a single white one. The Court ruled for them in 1960 without a dissent and printed the figure at the back of the opinion.
The opinion was written by Felix Frankfurter, who fourteen years earlier had turned away a challenge to Illinois’s congressional districts on the ground that “courts ought not to enter this political thicket.” A federal court will strike down lines drawn against a race. Lines drawn against a party were left in the thicket, where they remain.
Tuskegee, before and after
5Tennessee, 1901 to 1962
The cheapest gerrymander is to leave the map alone. Tennessee’s constitution told the legislature to reapportion itself every ten years, and after 1901 the legislature stopped. For sixty years people moved and the districts did not, until the plaintiffs could tell the Supreme Court that one vote in Moore County was worth nineteen in Hamilton County.
Congress had treated the whole country the same way. After the 1920 census, the first to find more Americans in cities than outside them, the House went unreapportioned for the only time in its history, and almost every state kept its districts for twenty years.
Baker v. Carr, the Tennessee case, had to be argued twice. Justice Charles Whittaker drafted opinions on both sides, left Washington, suffered a breakdown and never returned to the bench. Chief Justice Earl Warren, who had presided over Brown v. Board of Education, called Baker the most consequential case of his career, and two years later put its principle in seven words: “Legislators represent people, not trees or acres.”
Districts now had to hold equal numbers of people and be redrawn after every census. That finished the Tennessee method and made the other kind a ten-year appointment. When the Court tightened the rule in 1969, Justice Byron White pictured where it led: “a computer can produce countless plans for absolute population equality, one differing very little from another, but each having its own very different political ramifications.” He meant it as a warning.
6California, 1981
White’s computer was not yet needed. Phil Burton, a congressman from San Francisco, drew California’s forty-five House districts after the 1980 census, and a Republican staffer who watched him present them wrote later that he had done it without one. As the staffer remembered the press conference, Burton went down the map county by county, counting aloud, and pronounced the Republican Don Clausen “in his mother’s arms.” Clausen lost the next election by 5,700 votes. Burton drew a district for his brother John, who decided not to run. Burton called the map “my contribution to modern art.”
California voted the plan down in a referendum in June 1982, too late to keep that year’s election off it. Democrats came out with twenty-eight seats to seventeen.
The complaint that carried furthest came from a Californian. Gerrymandering was “antidemocratic and un-American,” President Reagan told a dinner of Republican governors in 1987, and the congressional map “a horror show of grotesque, contorted shapes.” He repeated the modern-art line. The transcript says “[Laughter].”
Lines, this site’s atlas of redistricting, has set a computer the same task on today’s California, with instructions to draw it for the Democrats as hard as the rules allow. It gets about fifty of the fifty-two seats. The map California adopted last year gets forty-five or forty-six.
California by hand, 1981, and by computer
Burton’s districts are outlines: this page has no vote to color them with. The computer’s are colored as on Lines, by the 2024 presidential vote moved to a tied national year.
By hand. Phil Burton’s 45 districts, used once, in 1982.
By computer. Lines’ all-out Democratic map of today’s 52 districts. Democrats win about 50.
7North Carolina’s 12th, 1992
By the nineties the monsters had lengthened. North Carolina’s 12th District ran about 160 miles up Interstate 85 and for much of the way was no wider than the road. “If you drove down the interstate with both car doors open,” a state legislator said, “you’d kill most of the people in the district.” Justice Sandra Day O’Connor quoted him in a 1993 opinion, together with a poem the district had inspired: “Ask not for whom the line is drawn; it is drawn to avoid thee.”
The 12th existed because the Justice Department had objected to a map with one majority-Black district in a state whose voting-age population was a fifth Black. The legislature added a second, and the interstate was where it found the people. O’Connor wrote that such a district “bears an uncomfortable resemblance to political apartheid.”
8Illinois’s 4th, 1991
Chicago’s 4th District is two pads of city joined by a thin band, and it is called the earmuffs. In 2014 a Washington Post ranking of the country’s most gerrymandered districts put it in the top ten. It was installed by a federal court in 1991, from a plan Republicans had submitted, so that the Puerto Rican and Mexican neighborhoods of Logan Square, Humboldt Park, Pilsen and Little Village could together elect a member of Congress.
By Tisdale’s test the earmuffs and the interstate are as bad as gerrymanders get. Both were drawn to put someone in Congress who had not been getting there.
The interstate and the earmuffs, at the same scale
Both as first drawn, for the election of 1992.
North Carolina’s 12th, from Gastonia to Durham, and Illinois’s 4th at the same scale. The gray lines are county lines.
The 4th, enlarged about 4 times. The gray lines are the edges of Cook County; the eastern one is the shore of Lake Michigan.
9A house in Brooklyn, a house in Chicago
A line can be drawn around one person. Hakeem Jeffries, who now leads the Democrats in the U.S. House, has said that in 2002 the New York legislature drew one around his house in Brooklyn, and he had to move to run for the State Assembly. In Chicago the congressional map drawn after the 2000 census passed two blocks from the home of a state senator who had just challenged the incumbent. The state senator, Barack Obama, was drawing a map himself, in a room in Springfield that Democratic staff called “the inner sanctum,” behind a fingerprint scanner. It extended his own district up the lakefront into the Gold Coast.
10Ward 2, Anamosa, Iowa
The census counts prisoners where they are locked up. Anamosa, Iowa, had four city council wards of about 1,400 people each, and Ward 2 contained the state penitentiary. That made 1,300 inmates, none of whom could vote, and 58 other residents. Danny Young, a backhoe operator for the county, won the ward’s council seat with two votes, both write-ins, one from his wife and one from a neighbor. The New York Times asked him about the inmates. “Do I consider them my constituents?” he said. “They don’t vote, so, I guess, not really.”
11Maryland’s 3rd and Pennsylvania’s 7th, 2011
After the 2010 census the districts got nicknames and the nicknames got into court records. A federal judge wrote that beside Maryland’s 3rd, drawn by Democrats, the original gerrymander “looks tame by comparison,” and that the district was “more reminiscent of a broken-winged pterodactyl, lying prostrate across the center of the State.” Pennsylvania’s 7th, drawn by Republicans, was “Goofy kicking Donald Duck.” The state’s Supreme Court noted that it stayed in one piece at two points only by way of “a medical facility and a seafood/steakhouse.”
Republicans had prepared for that census. A party committee raised about thirty million dollars in 2010 for a project it called REDMAP, aimed at the legislatures that would hold the pen. After the next election the committee wrote up its results. Democratic candidates for the House had drawn over a million more votes than Republicans, it noted, and Republicans held the chamber by thirty-three seats.
Maryland’s 3rd and Pennsylvania’s 7th, as drawn in 2011
Each at its own scale. The gray lines are county lines.
“more reminiscent of a broken-winged pterodactyl, lying prostrate across the center of the State.”
Maryland’s 3rd, drawn by Democrats, as a federal judge described it.
“a medical facility and a seafood/steakhouse.”
Pennsylvania’s 7th, drawn by Republicans: what held it in one piece at two points, as the state’s Supreme Court noted.
IIOut loud
12Laurel Street, Greensboro, 2016
Thomas Hofeller, for years the Republican National Committee’s redistricting man, trained legislators from a slide deck. “Emails are the tool of the devil,” one slide said. He died in 2018 leaving seventy thousand files, which his estranged daughter found in his room on four hard drives and, in a clear plastic bag, eighteen thumb drives.
One set of files concerned Greensboro, where the line between North Carolina’s 6th and 13th Districts ran along Laurel Street, through the campus of North Carolina A&T, the country’s largest historically Black university. Hofeller’s spreadsheets had the students sorted by dormitory. On the map the line is a street. Another set recorded a job in Massachusetts, where a Republican had hired him to draw a map that might elect one. “Hofeller drew several sets of maps,” David Daley reported in The New Yorker, “but the effort went nowhere.” And there was an email written the day after a grim prognosis: “I still have time to bedevil the Democrats with more redistricting plans before I exit. Look my name up on the Internet and you can follow the damage.”
His clients in Raleigh had stopped taking the advice on the slides. In 2016, after a court threw out two districts as drawn by race, David Lewis, who co-chaired the redistricting committee, told his colleagues that the replacement map would elect ten Republicans and three Democrats because he did “not believe it [would be] possible to draw a map with 11 Republicans and 2 Democrats.” He went on: “I think electing Republicans is better than electing Democrats. So I drew this map to help foster what I think is better for the country.”
The lawsuit reached the Supreme Court in 2019 beside one from Maryland, where the Democratic congressman who advised on the map had called himself a “serial gerrymanderer.” The Court held such complaints “beyond the reach of the federal courts.” Lewis, it turned out, had been building a defense. A map drawn for a race can be struck down, a map drawn for a party cannot, and the safest thing a mapmaker can now say about his work is that he did it for the party.
Laurel Street, Greensboro, 2016
The line between North Carolina’s 6th and 13th Districts, as drawn in 2016, where it crossed the campus of North Carolina A&T.
- District line
- North Carolina A&T
13Texas, 2003 and 2025
One night in May 2003 more than fifty Democrats slipped out of Austin for a Holiday Inn in Ardmore, Oklahoma, just past the reach of the Texas Rangers, to keep the Texas House from voting on a new congressional map. “At first it seemed a little comical, because this had never happened before and we didn’t know what to do,” said one of the Republicans left on the floor, Phil King of Weatherford. “But after you’ve ordered fajitas for 100 people that evening, it begins to get a little bit serious.” King was the author of the map, which became law that year.
From 1970 through 2024, by Ballotpedia’s count, two states redrew their congressional maps in mid-decade by choice. In the fourteen months since August 2025, six have passed new ones.
“I got the highest vote in the history of Texas,” President Trump told CNBC on August 5, 2025. “And we are entitled to five more seats.” More than fifty Texas House Democrats had left two days before, this time for Illinois and elsewhere, and after two weeks they came home to an around-the-clock escort of state troopers. On August 20 Todd Hunter of Corpus Christi laid out the map. “The underlying goal of this plan is straightforward: improve Republican political performance,” he said, and the House passed it, 88 to 52.
Nobody would say who drew it. Hunter told colleagues he was not aware; the House committee chairman said he did not know who Adam Kincaid was. The chairman of the Senate committee allowed that he had spoken with Kincaid three times and had told him, “Don’t tell me anything you’re doing with regard to map drawing.” The Senate chairman was Phil King. Kincaid, who runs the National Republican Redistricting Trust, cleared it up under oath in El Paso that October. By Democracy Docket’s account of his testimony, the Republican National Committee had hired him to draw the map, and he had kept in touch with the White House on Signal, with the messages set to delete themselves.
A lower court blocked the map as a racial gerrymander and the Supreme Court put it back that December. “The impetus for the adoption of the Texas map (like the map subsequently adopted in California),” Justice Samuel Alito wrote, “was partisan advantage pure and simple.” In a federal court that is now a finding of innocence.
Texas, 2021 and 2025
Each district is colored as on Lines: by its 2024 presidential vote, moved to a tied national year.
Drawn in 2021. Used in 2022 and 2024.
Drawn in 2025. On the ballot this November.
14Lodi, California, 2025
California answered the next day. Its legislature passed a map of its own on August 21 and sent it to the voters as Proposition 50, which set aside, through 2030, the citizens’ commission those same voters had put in charge of congressional districts in 2010. “We’re neutralizing what occurred,” Governor Gavin Newsom said. It passed in November with 64 percent.
The lines were drawn by Paul Mitchell, a Sacramento consultant, who took suggestions from California’s Democrats in Congress. Lodi, a city of 66,000 that had been in one district, is now in three, a consequence of moving Stockton voters to strengthen a Democratic district nearby. Mitchell had history with the commission. A 2011 ProPublica investigation, “How Democrats Fooled California’s Redistricting Commission,” described him as “the consultant whose work had such a large impact on the commission’s decisions.” He told its reporters the maps were better for it. “My only regret,” he said, “is that we didn’t do more.”
“The purpose of this map was to pick up a Republican seat,” said Ralph Hise, a North Carolina senator, that October. “We’ve stated that over and over again.” Florida’s constitution forbids drawing a district “with the intent to favor or disfavor a political party.” Governor Ron DeSantis’s map went to Fox News an hour before it went to the Legislature, and his lawyer told lawmakers that federal law supersedes that part of the constitution.
Missouri managed to hold one election on two maps. The legislature redrew in September 2025, and opponents turned in more than 300,000 signatures to force a referendum. The secretary of state ran the August 2026 primary on the new districts anyway, more than a million people voted in it, and a month later the state Supreme Court ruled that the new map had never been law. The general election will be held on the old districts, with the new ones further down the ballot as a referendum.
Some legislators declined. Twenty-one Republican state senators in Indiana joined ten Democrats to vote a new map down, and South Carolina’s Senate adjourned sooner than cut off debate on one. The Democratic president of Maryland’s Senate would not take up an eight-to-nothing map his governor’s commission had approved. Virginia’s Democrats got a ten-to-one map through a referendum in April and lost it in the state Supreme Court on a point of procedure.
The round, August 2025 to October 2026
- Voting on new lines this NovemberAlabama, California, Florida, Louisiana, North Carolina, Ohio, Tennessee, Texas, Utah
- Passed a new map; a court stopped itMissouri, Virginia
- The legislature declinedIndiana, Maryland, South Carolina
15Memphis, 2026
On April 29, 2026, the Supreme Court decided Louisiana v. Callais, six to three. “Today’s decision renders Section 2 all but a dead letter,” Justice Elena Kagan wrote in dissent. Section 2 is the part of the Voting Rights Act that had protected minority voters’ districts. Louisiana’s governor read the ruling the same way, with more enthusiasm: “drawing districts for political reasons is the States’ prerogative, not a federal civil-rights violation.” Florida’s Legislature passed the DeSantis map the same day.
Tennessee, the state that once went sixty years without redrawing, took three days. The legislature met on May 5. The public had twenty-four hours with the map. The governor signed it on May 7, along with the repeal of a state law against redistricting in mid-decade. The state’s one majority-Black district, in Memphis, became three districts, two of which run to the suburbs of Nashville. “The map was drawn to maximize Republicans’ ability to win nine congressional seats,” said John Stevens, its sponsor in the Senate. Tennessee has nine.
Three federal judges declined to block it. “The road to a reliably 9-0 map runs through Memphis,” they wrote. “Thus, political motivations readily explain the map’s dilutive effects.” In Tuskegee the shape had been the evidence. In Memphis the motive was the alibi.
Memphis, 2022 and 2026
Western and middle Tennessee. The dashed outline is Shelby County, which holds Memphis.
2022. The 9th District.
2026. The 5th, 8th and 9th Districts divide the old 9th among them.
Taking the pen away. Canada gave its districts to independent commissions in 1964 and has left them there. American states have tried it one at a time, and the past year tested each attempt. Michigan’s citizens’ commission began as a Facebook post two days after the 2016 election. “I’d like to take on gerrymandering in Michigan,” wrote Katie Fahey, who was 27, and added a smiley face. Its map is still in use. Utah’s voters passed an initiative against gerrymandering, the legislature overrode it, the state’s courts overrode the legislature, and Utah will vote on a map submitted by the people who sued. California’s commission drew two maps before the voters who created it suspended it, eleven weeks after the legislature asked them to.
IIIThe ruler
16The map on the ballot, 2026
Every way of telling whether a map is rigged has failed somewhere in this history. Shape convicted the earmuffs and acquitted Laurel Street. The mapmakers’ own word was once a confession and is now a defense. Counting seats against votes blames the lines for something voters do to themselves. Republicans are more than a third of Massachusetts, hold none of its nine House seats, and have not won one since 1994. Nobody drew that. Hofeller’s maps for his client there went nowhere.
Justice White’s “countless plans” turned out to be the way through. In the past decade mathematicians, Moon Duchin prominent among them, taught computers to draw legal districts by the thousand while knowing nothing about how anyone votes. Count the real votes inside each of those maps and you learn what a state’s geography does unassisted. Whatever the enacted map does beyond that, somebody did.
This site has run that test on the map in use this November. Lines holds 534 such no-goal maps of every state with three or more seats, each counted with the 2024 presidential vote, precinct by precinct. On the typical one for Texas, Democrats win about fifteen of thirty-eight seats. On the map Todd Hunter presented they win eight or nine, and none of the 534 does as well for Republicans. Seven other states’ maps stand outside their own 534, a seat or more from the typical one: Florida’s, North Carolina’s, Tennessee’s and Ohio’s for Republicans; California’s and Illinois’s for Democrats; and Pennsylvania’s, which a court chose, and which leans a seat toward Democrats because that is what it takes for an evenly divided state to elect an evenly divided delegation.
Texas: 534 maps drawn with no goal, and the one on the ballot
Each gray bar counts maps a computer drew with no goal, by the Democratic seats they would elect of Texas’s 38 with the national vote tied; the taller the bar, the more maps.
- 534 no-goal maps
- The map on the ballot
Democratic seats in a tied year
Add the states up and, in a year when the national vote is tied, Republicans start twelve seats ahead. About five of the twelve turn up on the computer’s maps too, because Democrats live packed into cities and spend votes there that elect nobody new. The other seven are lines. The majority that organized the current House was elected with 220 seats, two more than it needed.
The test has blind spots, beginning with the fact that the computer has never heard of the Voting Rights Act, and Lines lists them. The rest of it is there to be played with: twelve complete maps of all 435 districts, from each party’s all-out gerrymander to one that cuts every state in two with the shortest straight line that will do it, and a slider that moves the national vote from a Republican year to a Democratic one and recolors the districts as it goes.
Tisdale’s woodblocks survive. They are in the Geography and Map Division of the Library of Congress, an institution first proposed in the House in August 1789 by a member from Massachusetts, who moved that a committee consider what books Congress would need. The member was Elbridge Gerry.