Where the votes are
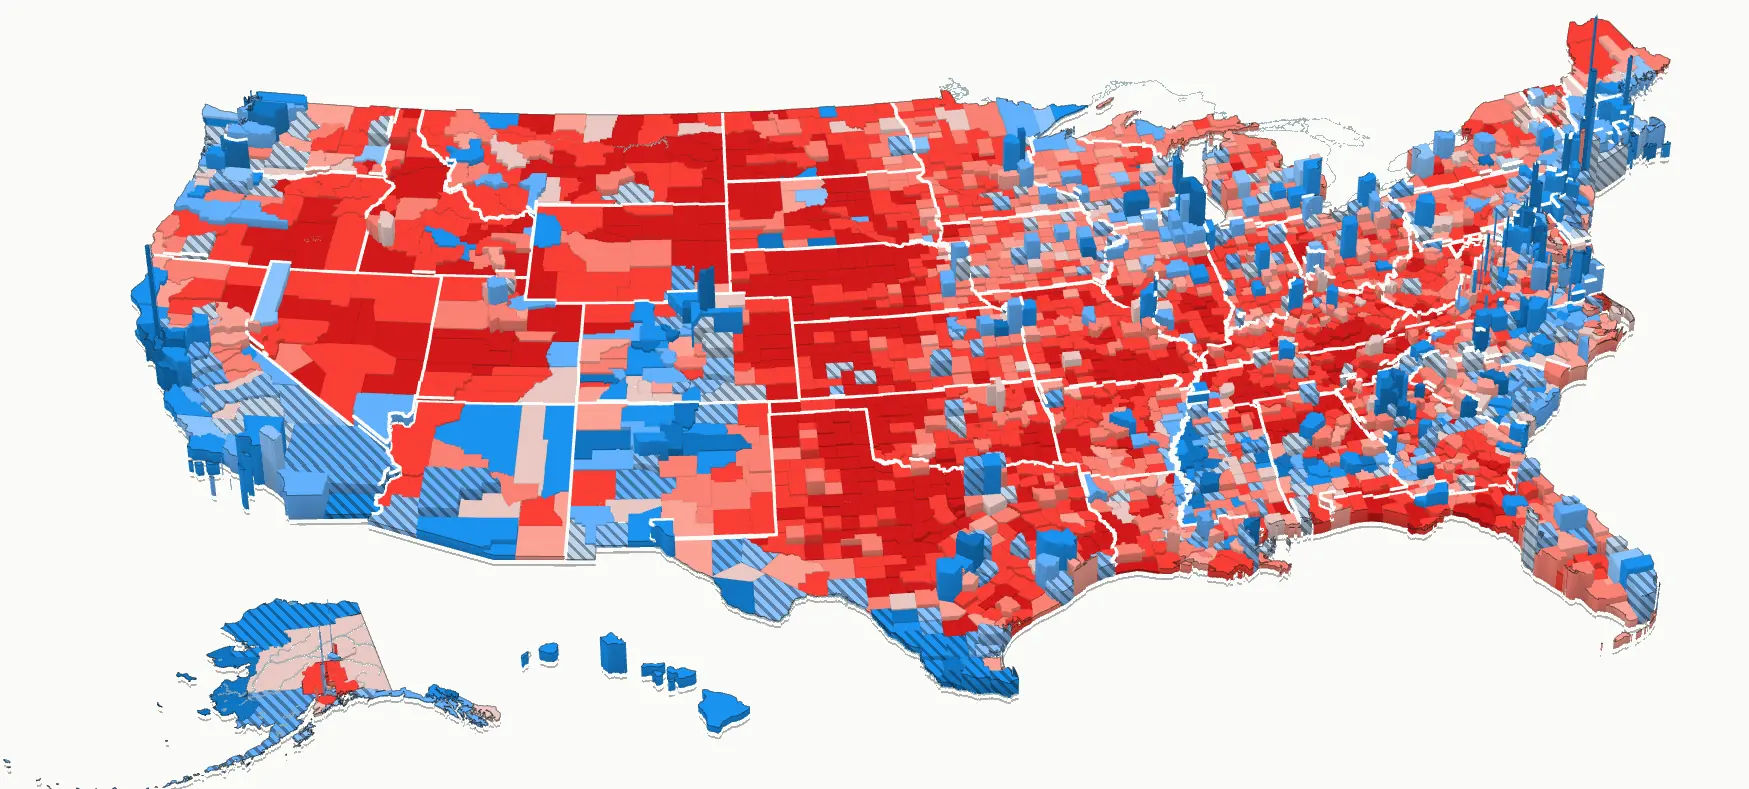
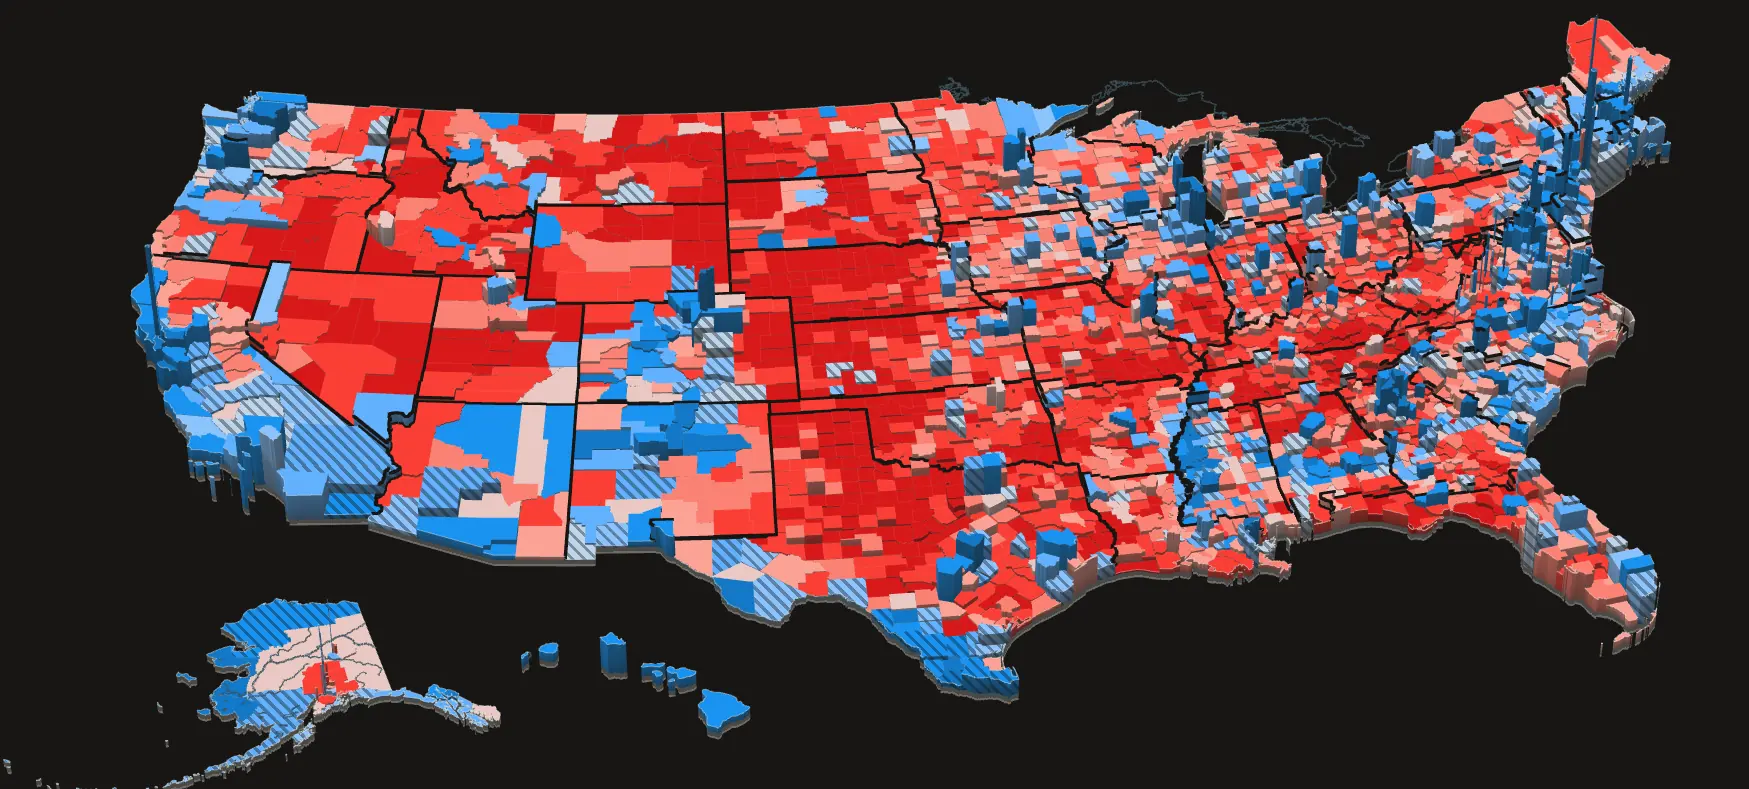
Every county as a block on a 3D map, red or blue by who leads its top race and as tall as its votes per square mile, so the cities stand tallest. Turn the map, and zoom in to street level.
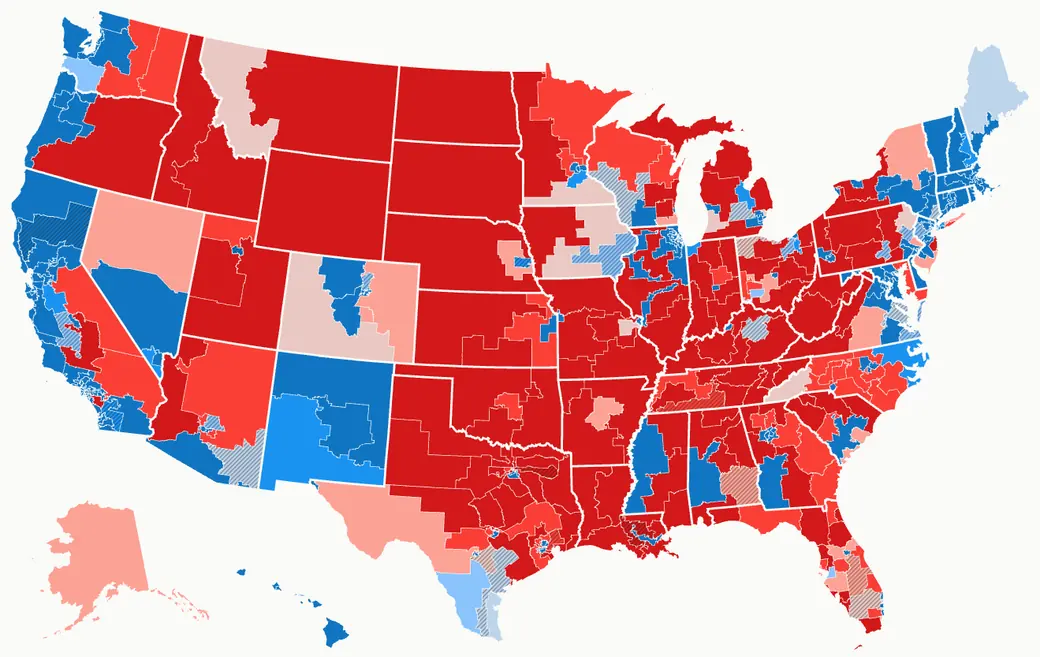
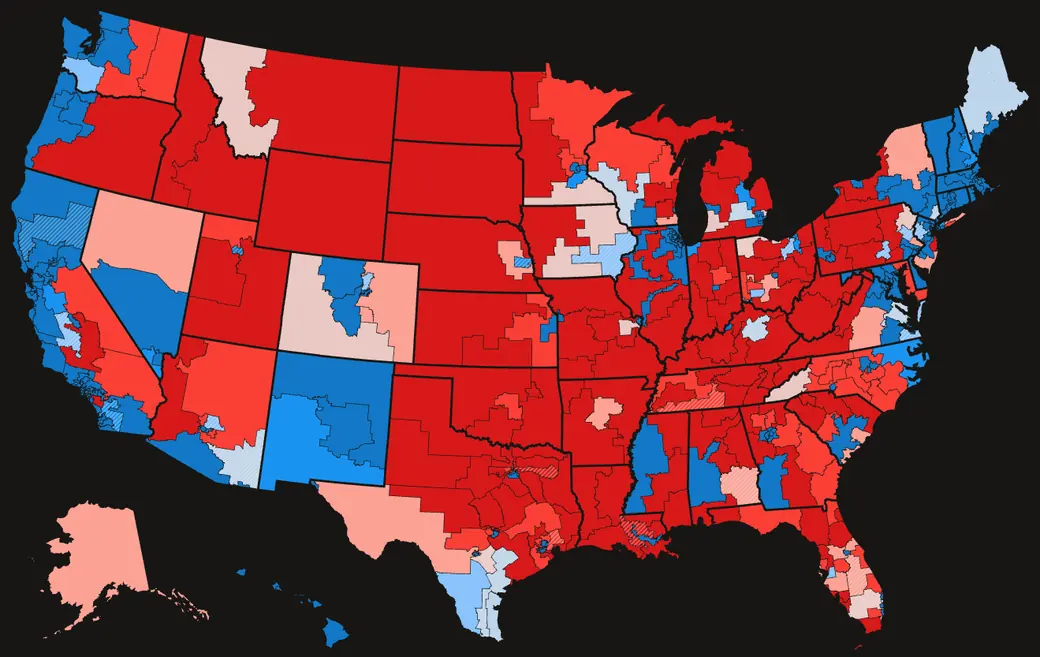
The maps, tools and games: the 2026 vote county by county and district by district, the House and the world drawn again, and the data under all of it. The analysis has its own page.
Every county as a block on a 3D map, red or blue by who leads its top race and as tall as its votes per square mile, so the cities stand tallest. Turn the map, and zoom in to street level.
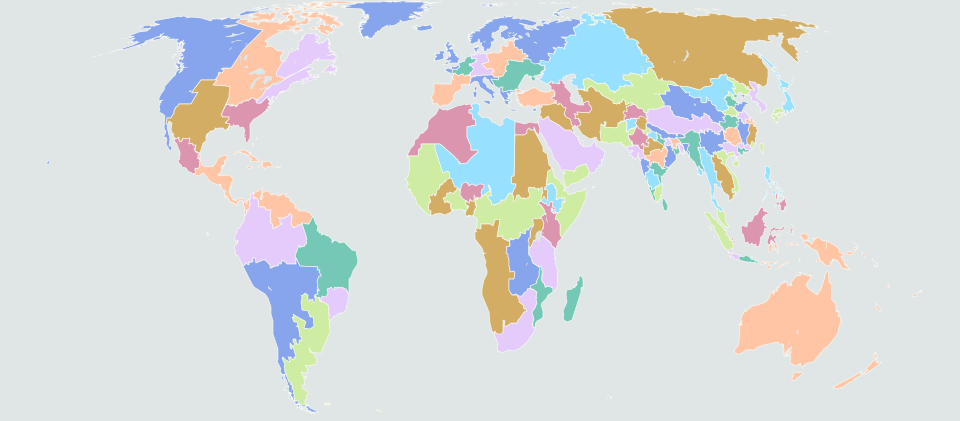
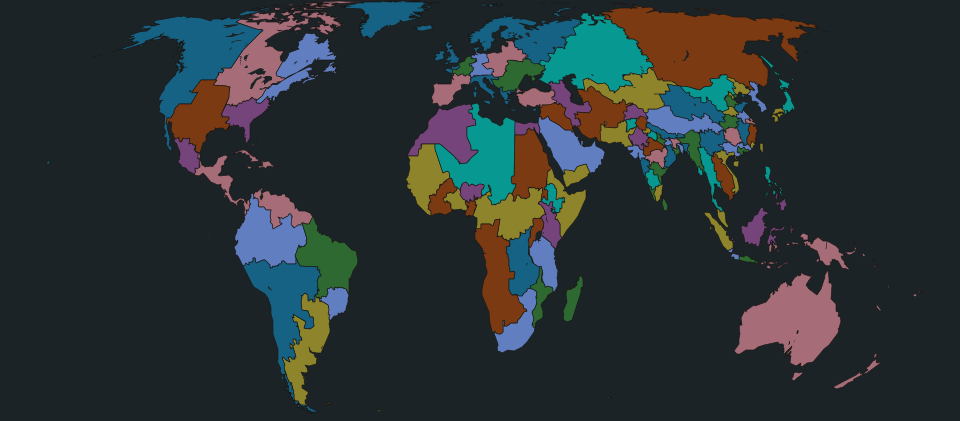
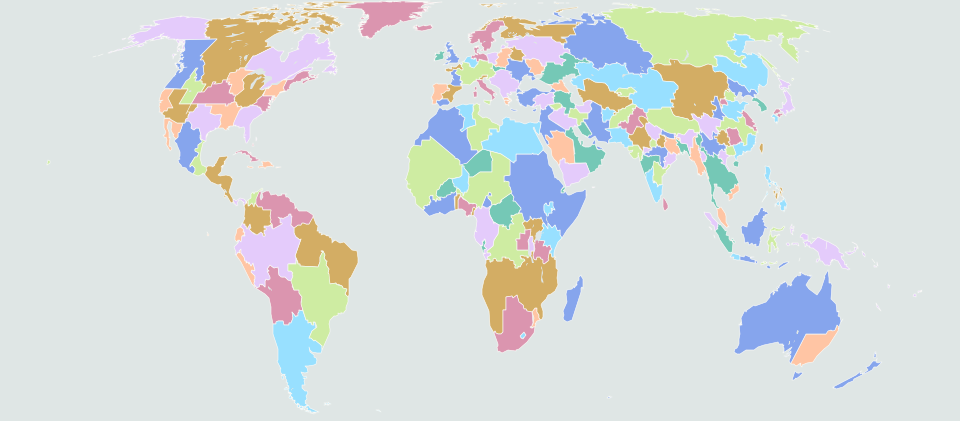
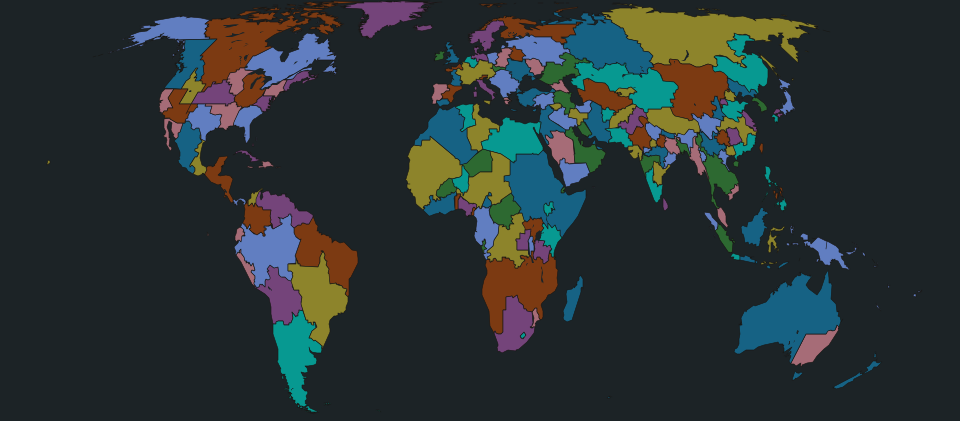
The world drawn again as one hundred nations of equal population, and the United States as fifty equal states, with how each would have voted. Every country has a flag and a capital, and most have a best XI.
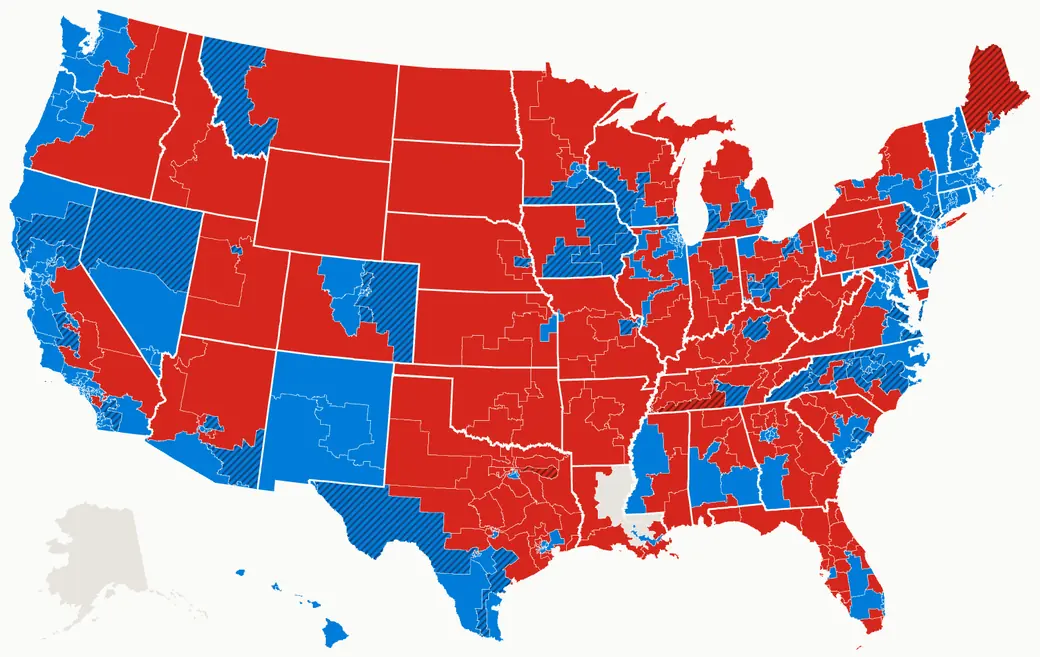
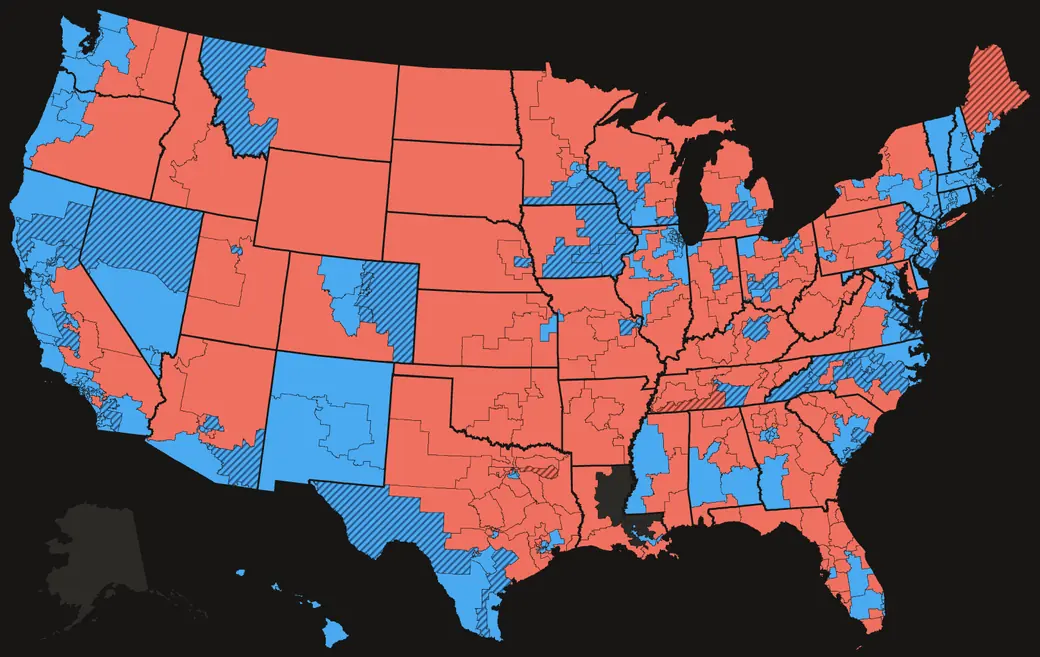
The 2026 results on one full-screen map: the House, the Senate and the governors, down to the precinct.
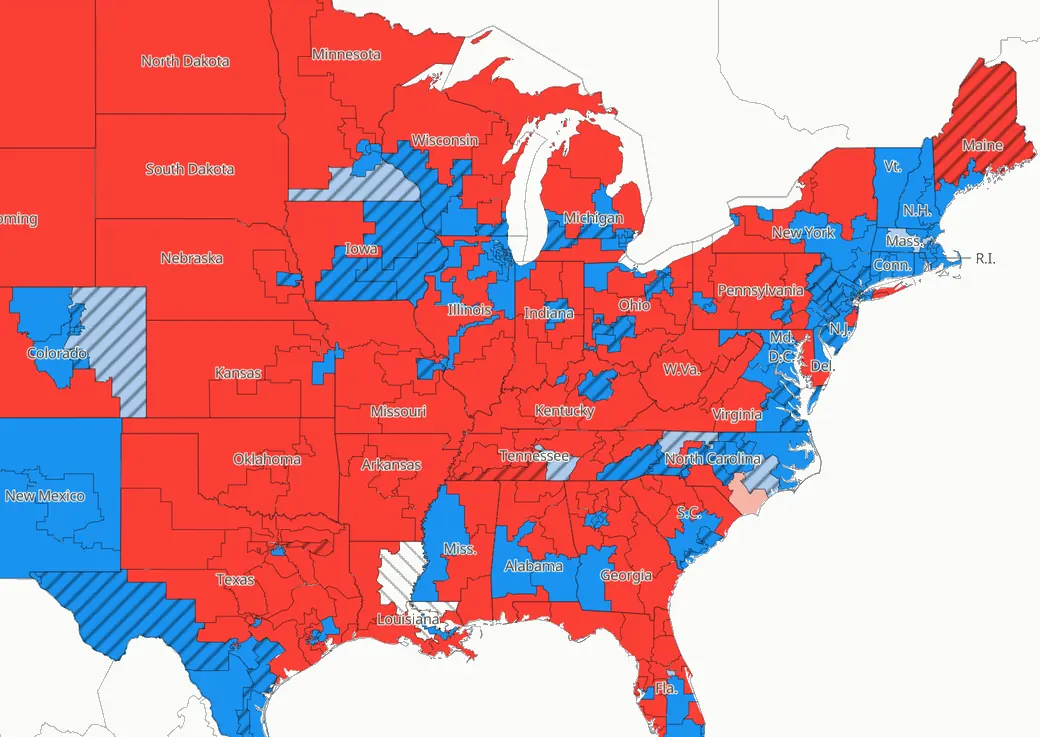
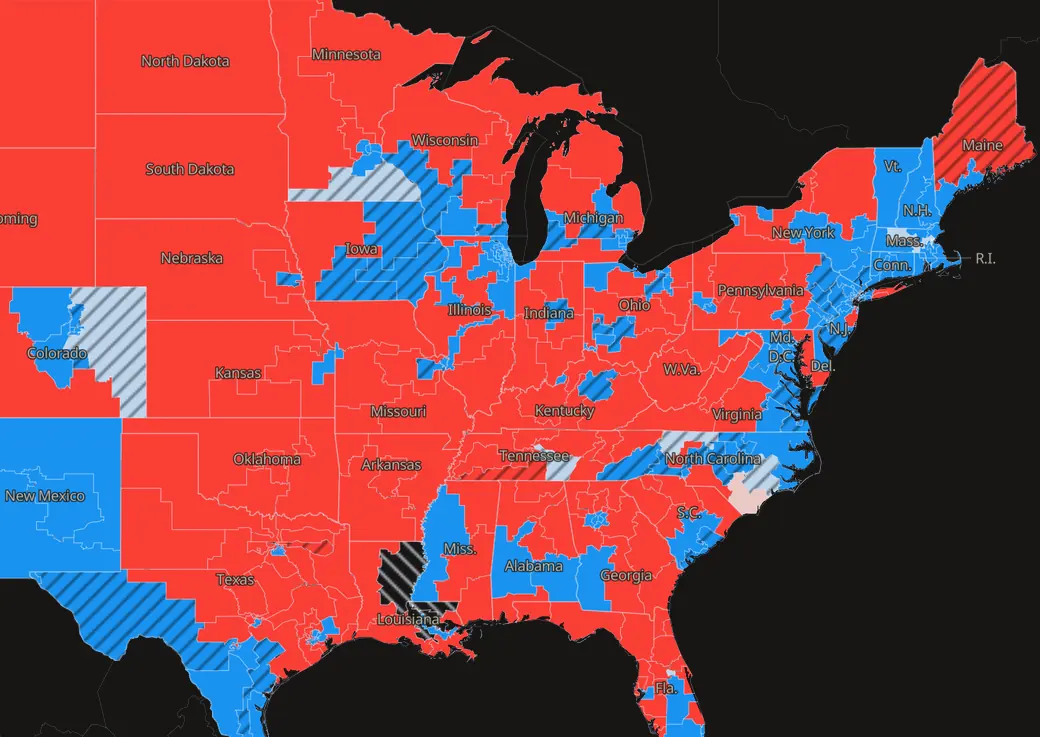
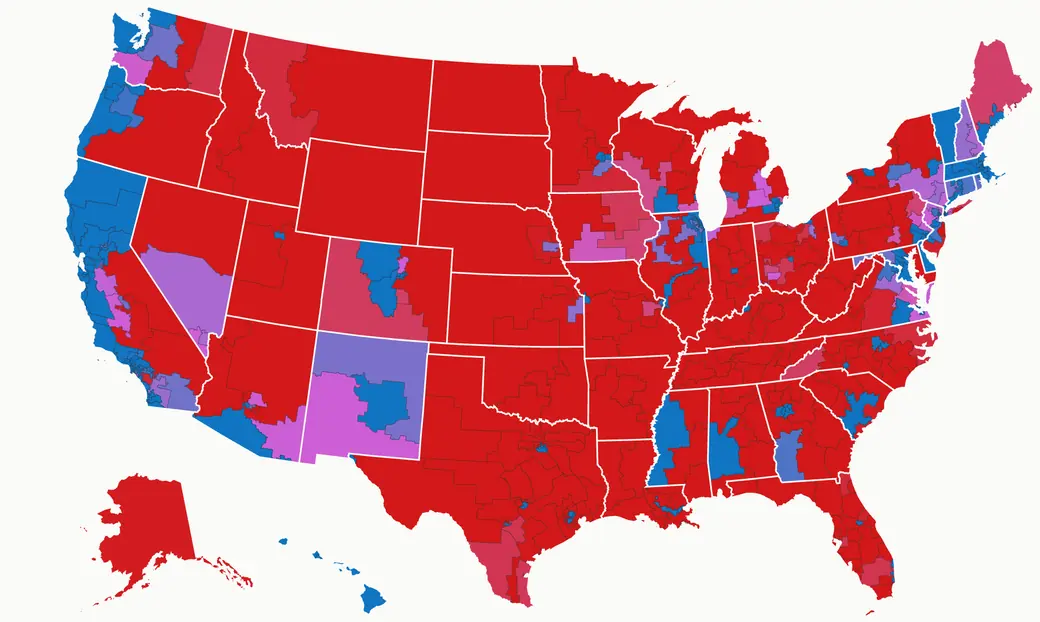
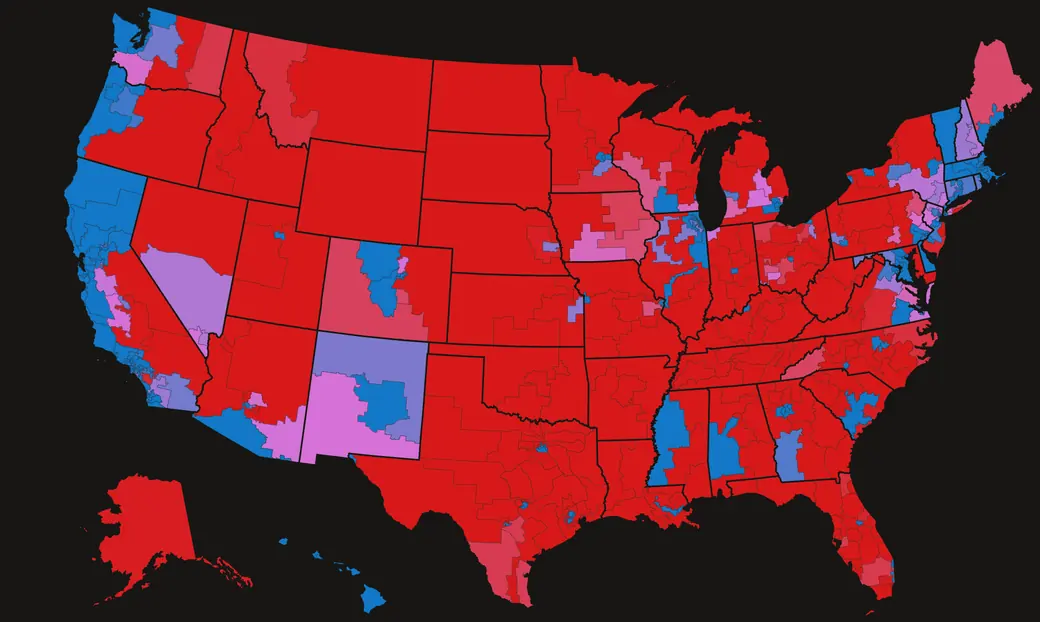
The House redrawn eleven ways, from gerrymanders to fair maps, with the 2026 vote on the real maps, the proposed ones and the lines of past decades.
Shift every race a point at a time toward either party and see who would have won the Senate, the House, the governorships and the legislatures.
Countries of any size, grown at random from real historical cores and named for them, so Europe splinters the way history made it. Pick one and read its dossier.
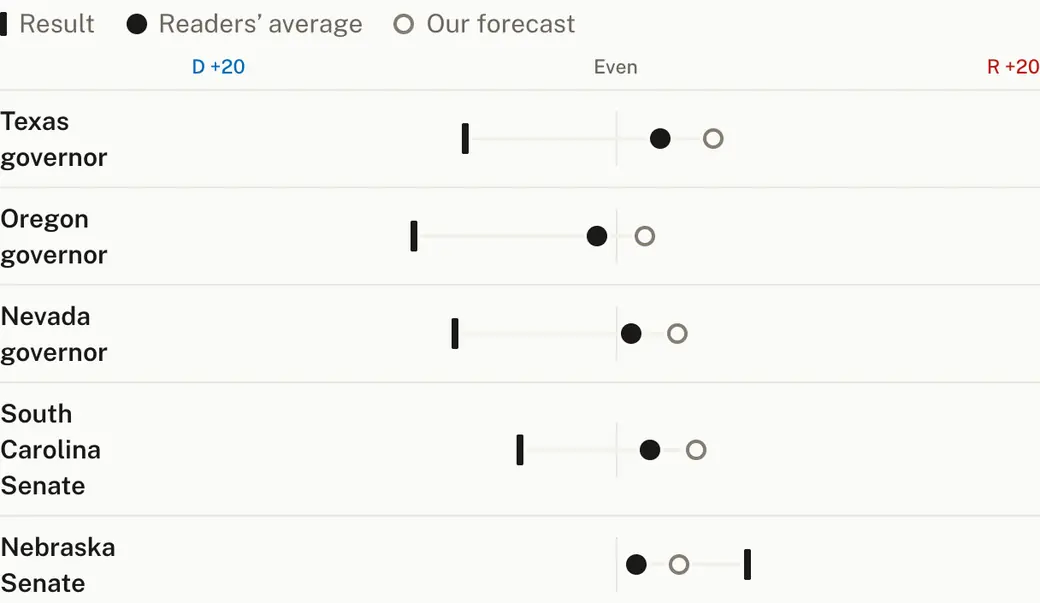
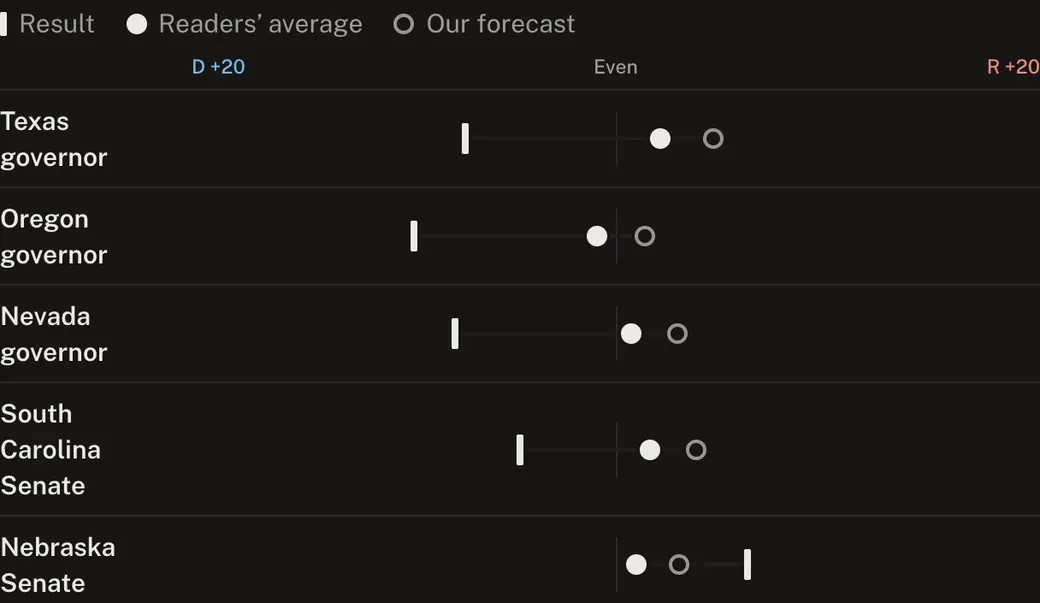
Readers picked the winners before the first polls closed. See who won, the full table, and the races that fooled most players.
Drag the national wave and the groups that make it up, and watch the House and the Senate fall under the final forecast.
Every race, county, legislature and ballot measure as CSV and JSON, with a data dictionary and one zip of everything, free to reuse with credit.
Any race, any state or the national picture as a card on your own site, sized to fit.
Type an address and see every 2026 result that was on that ballot, with how the county voted.
The forecast’s own tools are kept as they were in the 2026 forecast archive →