Call
the Map
2026 midterms

Redrawn · a side project

The world and the United States, drawn again

What if the borders started over? Four maps drawn from scratch out of real districts and counties, each with every country or state named, given a capital, a flag and a history, and measured the way a real one is. A game of what-ifs, not a proposal.

Open the explorer

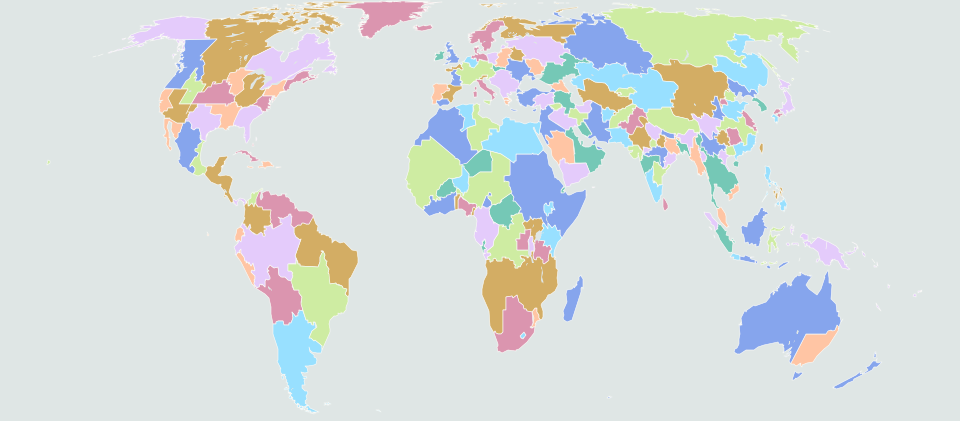
World · 180 countries

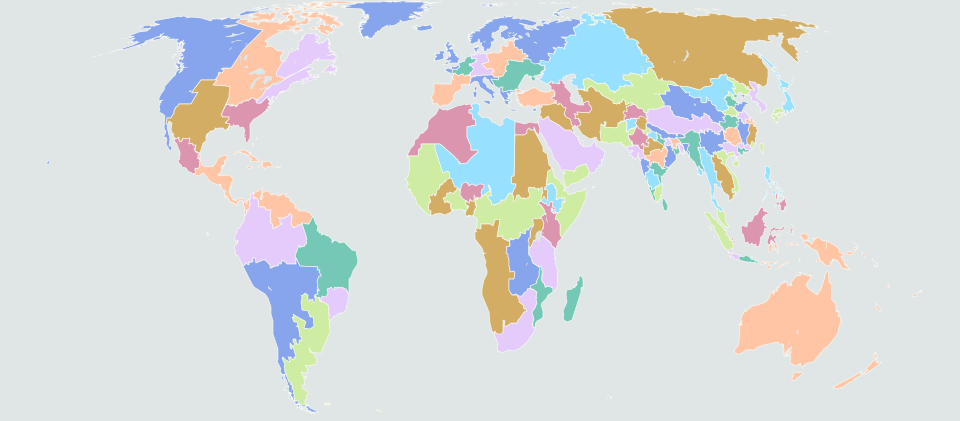
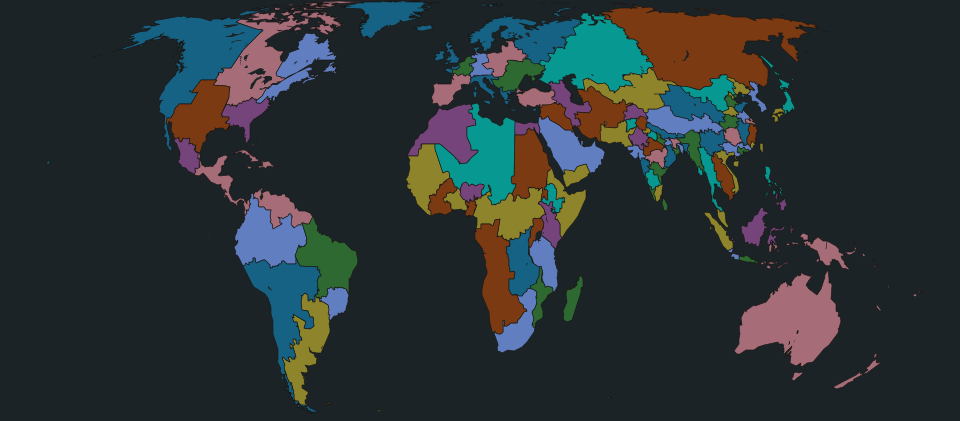
A Random World

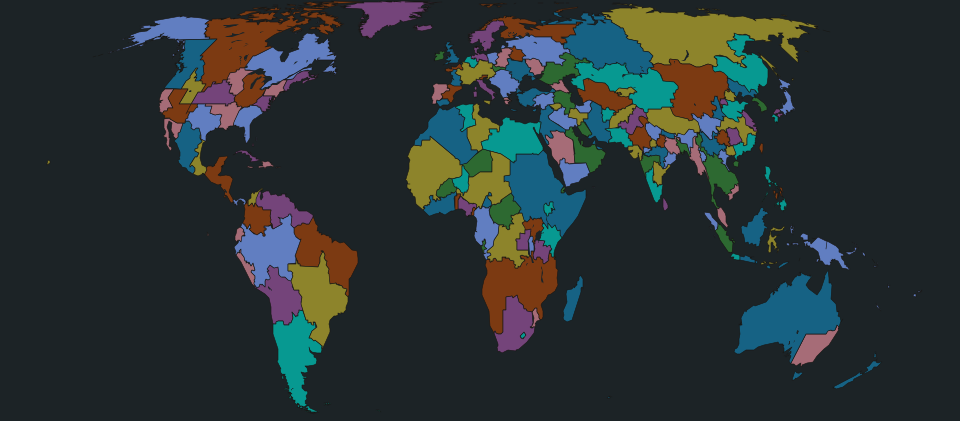
Countries of any size, grown at random from real historical cores and named for them, so Europe splinters the way history made it.

Countries
180
Most populous
Bihar, 277.9 M
Least populous
Greenland, 56,900
Largest
Siberia, 9,137k km²
Free cities and microstates
8
Richest per person
Luxembourg, $141,700
Poorest per person
Central African Republic, $1,400
Biggest economy
Alps, $5.93 tn
38 nuclear powers
Russia, Southern California, Cascadia, Texas, Siberia and others

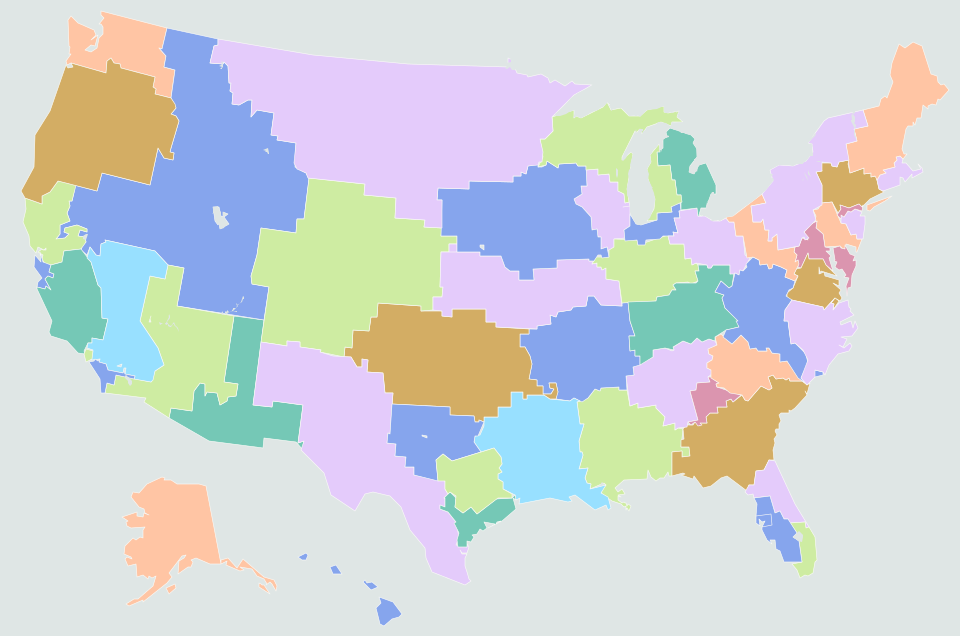
United States · 50 states

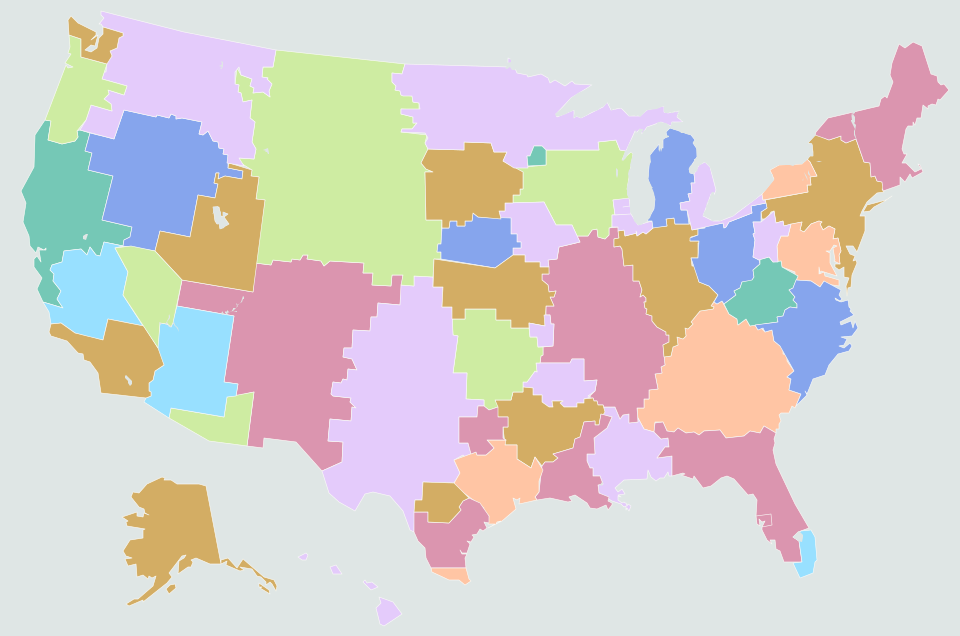
The Fifty Equal States

The United States split into 50 states of equal population, drawn from counties and census pieces without regard to today’s lines.

Electoral College, 2024–26 average
Democrats 321, Republicans 214
Senate, 2024–26 average
D 60, R 40
Tipping-point state, average
Texas, Democrats +8.1
States Democrats carry, average
30 of 50
Smallest to largest
6.88 M to 7.04 M
Richest per person
California, $152,000

Electoral College inside the new lines, Democrats–Republicans

  • 2004191 to 344
  • 2008331 to 204
  • 2012268 to 267
  • 2016289 to 246
  • 2020300 to 235
  • 2024257 to 278
  • 2026 House387 to 148

United States · 50 states

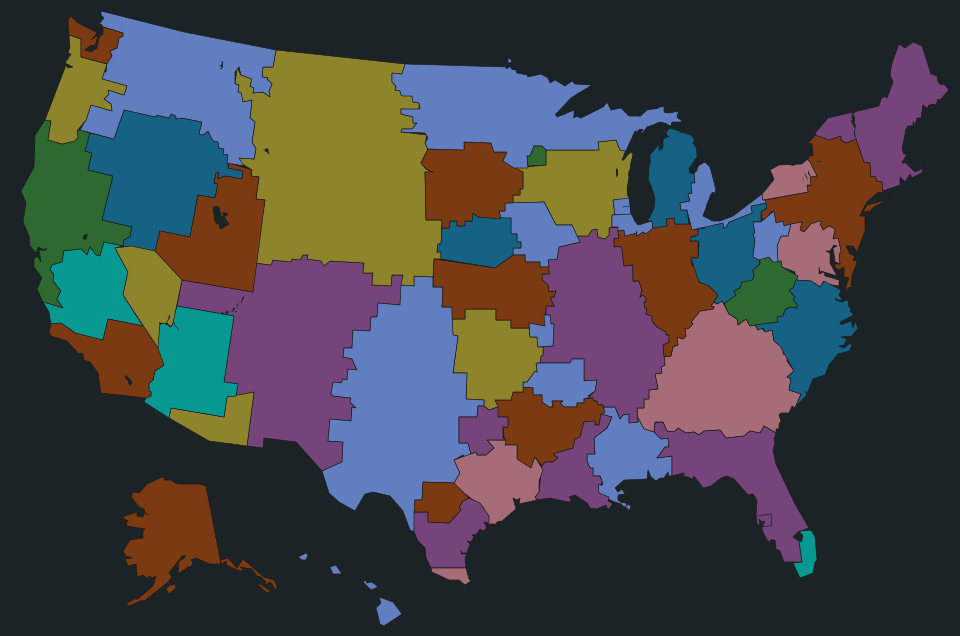
Fifty Other States

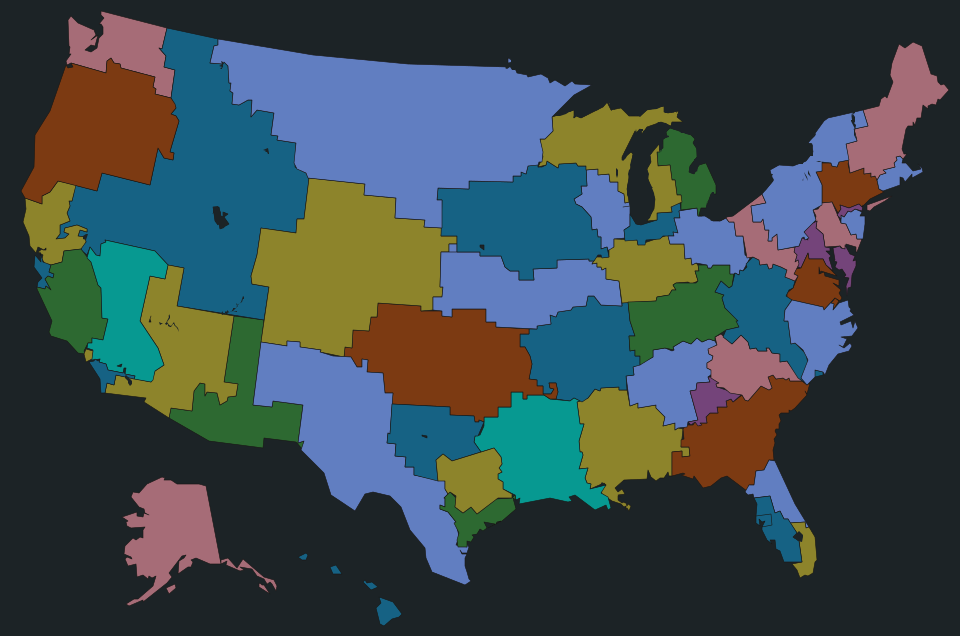
Fifty states of any size, grown from real regional centers out of whole counties, each named for a people, a river or an old claim on the land.

Electoral College, 2024–26 average
Democrats 287, Republicans 248
Senate, 2024–26 average
D 42, R 58
Tipping-point state, average
Texas, Democrats +2.2
States Democrats carry, average
21 of 50
Most populous
New York, 37.9 M
Least populous
Ozark, 624,400
Richest per person
Washington, $128,800

Electoral College inside the new lines, Democrats–Republicans

  • 2004240 to 295
  • 2008288 to 247
  • 2012268 to 267
  • 2016246 to 289
  • 2020270 to 265
  • 2024231 to 304
  • 2026 House374 to 161

How the maps are made

The world maps. Every country is built from about 60,000 real districts (GADM 4.1). Population is from the GHS-POP 2025 one-kilometer grid, GDP from the 2024 downscaled GDP grid of Kummu et al. (PPP), with nominal GDP using each source country’s World Bank price level; human development is the gridded 2015 estimate of Kummu et al. Military budgets and troops are inherited in proportion to the GDP and people each new country takes, and nuclear warheads go to whoever now holds the base.

Languages combine region-level mother-tongue estimates with Unicode CLDR speaker shares; “fluent” means roughly B2 level or better. Political positions are population-weighted estimates of public opinion, and the authority axis mixes how democratic the system is with nationalism and social conservatism. Flags are generated from each region’s color traditions. Football strength merges World Football Elo ratings and simulates a 48-team World Cup thousands of times; the starting elevens are footballers by birthplace.

The United States maps. Both are built from every county, with the counties of over 120,000 people cut into pieces of about 70,000 along the population grid. The equal map hands every piece to one of 50 centers so that each state gets the same population (within 1%) and stays compact; the other grows states from real regional centers and keeps counties whole. The votes are the 2024 county results counted again inside the new lines (Alaska and Connecticut use statewide shares), and House seats are shared out by the Huntington–Hill method used since 1941. The same pieces carry the county results of every presidential election from 2004 and the 2026 House vote, so each state can be colored by any of them, and each state’s seats are drawn as compact House districts of equal population.
Downloads

The data

MapSpreadsheetFiguresShapesDetailed shapesProfilesHouse districts
One Hundred Equal NationsCSV110 KBJSON246 KBJSON2.1 MBJSON3.9 MBJSON73 KB—
A Random WorldCSV180 KBJSON425 KBJSON2.1 MBJSON4.1 MBJSON116 KB—
The Fifty Equal StatesCSV25 KBJSON53 KBJSON227 KB—JSON25 KBJSON226 KB
Fifty Other StatesCSV24 KBJSON52 KBJSON223 KB—JSON23 KBJSON223 KB
Spreadsheet
one row per country or state, every figure (CSV)
Figures
every figure, list and flag, as the explorer reads them (JSON)
Shapes
borders, today’s borders, cities, rivers and lakes, in the map’s projected units (JSON)
Detailed shapes
the finest borders, which the explorer draws when zoomed far in (JSON)
Profiles
each place’s geography, landmarks and, for the world maps, economy (JSON)
House districts
the 435 districts of a US map, with their people and every election’s margin (JSON)