Analysis · The 2026 forecast, archived
How every 2026 forecast did
We scored 13 final forecasts of the midterms against the results, ours among them. On race-by-race win chances ours was last of the 7 that covered every office: next to last in the Senate, last for governors and next to last in the House.
Our own forecast, in detail: the full report is below the rankings.
- All races
- 7th of 7471 races
- Senate
- 11th of 1234 races
- Governors
- 8th of 835 races
- House
- 8th of 9402 races
Provisional until the results are certified. Results as of November 13, 2026, 5:39 PM ET; 22 races still open.
471 of the 506 races for Senate, governor and House are scored in the all-races table. The 22 open races and 13 others are left out for reasons listed below. Every figure on this page is read from that one snapshot of the count. Each forecast is scored from one capture of it, made on November 3.
Every forecast on one scale
A Brier score is the average squared gap between the chance a forecast gave the Republican and what happened: 0 is perfect, and calling every race a coin flip scores 0.25. On all 471 races Silver Bulletin scored 0.0336 and we scored 0.0474.
- Call the Map
- Other forecasts
All races471 races, 7 forecasts. Best: Silver Bulletin, 0.0336. Call the Map: 0.0474.
Senate34 races, 12 forecasts. Best: On Point Politics, 0.0432. Call the Map: 0.0739.
Governors35 races, 8 forecasts. Best: On Point Politics, 0.0257. Call the Map: 0.0784.
House402 races, 9 forecasts. Best: Silver Bulletin, 0.0310. Call the Map: 0.0424.
The rankings
Each table counts the called races that had a Republican running against another party and that every forecast in the table gave odds for. A forecast that skipped an office is missing from the all-races table. A missed call is a race where the forecast’s favorite lost; a 50-50 forecast counts as half a miss.
| Rank | Forecast | Brier score | Missed calls |
|---|---|---|---|
| 1 | Silver Bulletin | 0.0336 | 21 |
| 2 | VoteHub (Complete) | 0.0365 | 26 |
| 3 | VoteHub (Legacy) | 0.0380 | 29 |
| 4 | On Point Politics | 0.0413 | 24 |
| 5 | Race to the WH | 0.0423 | 26.5 |
| 6 | DDHQ / The Hill | 0.0431 | 29.5 |
| 7 | Call the Map | 0.0474 | 31 |
| Rank | Forecast | Brier score | Missed calls |
|---|---|---|---|
| 1 | On Point Politics | 0.0432 | 2 |
| 2 | Race to the WH | 0.0522 | 2 |
| 3 | Silver Bulletin | 0.0567 | 2 |
| 4 | Midterm Forecast | 0.0579 | 2 |
| 5 | Split Ticket | 0.0583 | 2.5 |
| 6 | 50+1 | 0.0635 | 3 |
| 7 | Rametta & Hare | 0.0652 | 3 |
| 8 | ElectIt | 0.0655 | 3 |
| 9 | VoteHub (Complete) | 0.0683 | 3 |
| 10 | VoteHub (Legacy) | 0.0719 | 4 |
| 11 | Call the Map | 0.0739 | 3 |
| 12 | DDHQ / The Hill | 0.0750 | 3 |
| Rank | Forecast | Brier score | Missed calls |
|---|---|---|---|
| 1 | On Point Politics | 0.0257 | 1 |
| 2 | Silver Bulletin | 0.0402 | 2 |
| 3 | VoteHub (Complete) | 0.0486 | 2 |
| 4 | Midterm Forecast | 0.0500 | 3 |
| 5 | VoteHub (Legacy) | 0.0527 | 3 |
| 6 | DDHQ / The Hill | 0.0584 | 2 |
| 7 | Race to the WH | 0.0586 | 3 |
| 8 | Call the Map | 0.0784 | 5 |
| Rank | Forecast | Brier score | Missed calls |
|---|---|---|---|
| 1 | Silver Bulletin | 0.0310 | 17 |
| 2 | VoteHub (Complete) | 0.0328 | 21 |
| 3 | Split Ticket | 0.0330 | 16 |
| 4 | VoteHub (Legacy) | 0.0339 | 22 |
| 5 | 50+1 | 0.0354 | 18 |
| 6 | DDHQ / The Hill | 0.0390 | 24.5 |
| 7 | Race to the WH | 0.0400 | 21.5 |
| 8 | Call the Map | 0.0424 | 23 |
| 9 | On Point Politics | 0.0425 | 21 |
The polls are scored on a page of their own: the 2026 pollster scorecard.
The uncalled races do not rescue us. Counting the 14 of them that every all-races forecast gave odds for, each for whoever leads now, we are 7th of 7 on 485 races. The 2 seats headed to runoffs are left out of that count, because a first-round lead is not a result. On the 157 races the other forecasts did not treat as safe, we are 7th of 7. Our forecast froze at noon Eastern on Election Day and some others kept updating; scoring them as they stood at noon leaves our rank the same in all four tables.
Every model leaned Republican. Ours leaned more than most.
Only 7 of the models published a margin for every race. Over 477 races between a Democrat and a Republican, each of them expected Republicans to do better than they did. Our margins were 6.3 points too Republican on average. The middle of the other 6 was 5.1, and On Point Politics came closest at 1.5.
| Rank | Model | Points too Republican, on average | Average miss |
|---|---|---|---|
| 1 | On Point Politics | 5.0 | |
| 2 | VoteHub (Complete) | 6.1 | |
| 3 | VoteHub (Legacy) | 6.1 | |
| 4 | Silver Bulletin | 6.3 | |
| 5 | Call the Map | 7.1 | |
| 6 | DDHQ / The Hill | 7.2 | |
| 7 | Race to the WH | 8.1 |
Our ranges were too narrow as well. The range we said would hold a race’s result 80% of the time held it in 61% of the 471 two-way races between a Democrat and a Republican. In 39% of them the result was more Democratic than the range, and in 1% more Republican.
The odds for Congress
Democrats won both chambers. Of the 12 forecasts that gave odds for both, ours gave them the lowest chance in each: 62% for the Senate and 83% for the House. Democrats have 55 Senate seats with 1 race uncalled, against our median of 52. In the House they have 250 with 20 uncalled, against our median of 234.
| Rank | Forecast | Senate | House |
|---|---|---|---|
| 1 | Poliwave | 85% | 99% |
| 2 | Silver Bulletin | 82% | 96% |
| 3 | Race to the WH | 81% | 96% |
| 4 | 50+1 | 79% | 98% |
| 5 | On Point Politics | 81% | 91% |
| 6 | ElectIt | 79% | 96% |
| 7 | Split Ticket | 77% | 92% |
| 8 | Midterm Forecast | 76% | 91% |
| 9 | VoteHub (Complete) | 68% | 89% |
| 10 | VoteHub (Legacy) | 67% | 89% |
| 11 | DDHQ / The Hill | 64% | 84% |
| 12 | Call the Map | 62% | 83% |
| Rametta & Hare | 68% | none |
Ranked by Brier score on the two chamber outcomes. Rametta & Hare forecast the Senate only and is not ranked.
The races most forecasts missed
In 25 races, more than half of the forecasts had the loser as the favorite. Democrats won all 25. We missed 31 calls out of 471. In 12 of those, no forecast had the winner ahead. No other forecast missed 3 of them: Oregon governor, Iowa 3rd and Texas 35th.
| Race | Winner | Forecasts that missed |
|---|---|---|
| Texas governor | Gina Hinojosa (D) | 8 of 8 |
| Indiana 5th | J.D. Ford (D) | 9 of 9 |
| North Carolina 6th | Cyril Jefferson (D) | 9 of 9 |
| North Carolina 9th | Richard N. Ojeda II (D) | 9 of 9 |
| North Carolina 13th | Paul Barringer (D) | 9 of 9 |
| North Carolina 14th | Lakesha Womack (D) | 9 of 9 |
| New Jersey 2nd | Zack Mullock (D) | 9 of 9 |
| Nevada 2nd | Teresa Benitez-Thompson (D) | 9 of 9 |
| Ohio 10th | Kristina Knickerbocker (D) | 9 of 9 |
| Ohio 15th | Don Leonard (D) | 9 of 9 |
| Mississippi Senate | Scott Colom (D) | 12 of 12 |
| Texas 9th | Leticia Gutierrez (D) | 9 of 9 |
| South Carolina Senate | Annie Andrews (D) | 11 of 12 |
| Colorado 5th | Jessica Killin (D) | 8 of 9 |
| Florida 9th | Darren Soto (D) | 8 of 9 |
| South Carolina 1st | Nancy Lacore (D) | 8 of 9 |
| Kansas governor | Cindy Holscher (D) | 7 of 8 |
| Alabama 2nd | Shomari C. Figures (D) | 7 of 9 |
| Michigan 4th | Sean McCann (D) | 7 of 9 |
| Missouri 2nd | Fred Wellman (D) | 7 of 9 |
| Texas 23rd | Katy Padilla Stout (D) | 7 of 9 |
| Wisconsin 1st | Mitchell Berman (D) | 7 of 9 |
| Iowa Senate | Josh Turek (D) | 7 of 12 |
| Kentucky 6th | Zach Dembo (D) | 5 of 9 |
| Pennsylvania 1st | Bob Harvie (D) | 5 of 9 |
Counted among the forecasts in that office’s table. Each race links to its result.
What is scored, and what is not
Each forecast is the last version we read before 6 PM Eastern on November 3. Ours is the final edition, published at 11:38 AM Eastern that day and frozen at noon.
The results are official state and county counts as published at 5:39 PM Eastern on November 13, 2026, the same snapshot the full report on our forecast uses. A race is scored once it is called. Uncalled races are left out of every table and listed here, and the scores will be run again when they are called and when margins are final.
Every forecast is scored on one question per race: did the Republican win. That is the one number every source publishes the same way, because some list an independent in the Democratic column.
| Races | Senate | Governors | House |
|---|---|---|---|
| On the ballot | 35 | 36 | 435 |
| Not called yet | 1 | 1 | 20 |
| Called, but no Republican ran against another party | 0 | 0 | 12 |
| Called, but one forecast gave no odds | 0 | 0 | 1 |
| Scored | 34 | 35 | 402 |
- Senate, not called yet (1)
- Alaska Senate
- Governors, not called yet (1)
- Alaska governor
- House, not called yet (20)
- AK-AL, AZ-02, CA-04, CA-23, CA-40, CO-04, FL-10, FL-27, LA-05, LA-06, MA-02, MA-05, MA-07, MN-01, NC-03, NC-05, NC-07, NC-10, TN-04, WA-05
- House, no Republican against another party (12)
- CA-06, CA-07, CA-11, CA-12, CA-14, CA-29, CA-34, CA-37, MA-01, NJ-08, PA-03, WI-02
- House, one forecast gave no odds (1)
- LA-02
| Forecast | Read at | Senate | Governors | House |
|---|---|---|---|---|
| Call the Map CTMM 2.2, final edition | 12:09 PM | 35 | 36 | 435 |
| Silver Bulletin Deluxe version; scored from its subscriber forecast | 5:38 PM | 35 | 36 | 435 |
| DDHQ / The Hill | 5:38 PM | 35 | 36 | 435 |
| VoteHub (Complete) polls, fundamentals, Kalshi odds and expert ratings | 5:39 PM | 35 | 36 | 435 |
| VoteHub (Legacy) polls and fundamentals | 5:39 PM | 35 | 36 | 435 |
| Race to the WH | 5:38 PM | 35 | 36 | 435 |
| Split Ticket published at The Argument | 5:38 PM | 35 | none | 435 |
| 50+1 | 5:38 PM | 35 | none | 417 |
| Rametta & Hare Senate only, default view | 5:38 PM | 35 | none | none |
| Midterm Forecast | 5:38 PM | 35 | 36 | 153 |
| On Point Politics | 5:38 PM | 35 | 36 | 435 |
| ElectIt Senate race odds; chamber odds for both | 5:38 PM | 35 | none | none |
| Poliwave chamber odds only; no race odds published | 5:38 PM | none | none | none |
The Senate, Governors and House columns count the races each forecast gave odds for. Every score comes from one capture of that forecast’s public pages on November 3, at the time shown, and the forecast’s own name links to where it was read. A forecaster who reads its own numbers differently is the authority on its own forecast.
Prediction markets are not ranked here, because a market price is a price, not a forecast.
Silver Bulletin: its scores come from its subscriber forecasts as we captured them on November 3; its race-by-race numbers are not shown. We did not capture The Economist’s race forecasts or any expert ratings, so neither is here.
This is one election, and its races moved together. A single year can show how each forecast did; it cannot show which model is better over time. Sources define margin slightly differently, and all are compared with the total-vote result.
Our forecast, in detail
How the 2026 forecast performed
Download the report (PDF)54 pages, 3.0 MB
Performance report on the final CTMM 2.2 forecast of the 2026 U.S. midterm elections. Prepared November 14, 2026, from results as of November 13, 2026. Counts are not final and 22 of the 506 forecast races are not yet called.
Abstract
This report scores the final Call the Map forecast of the 2026 Senate, House and governor elections against the results, against twelve other model forecasts, and against simple baselines computed here. It then removes the model's components one at a time to measure what each contributed.
The forecast was the least accurate probability forecast among the seven sources that covered every office. Its Brier score was 0.0547 over 485 races when races that are not yet called are assigned to the current leader, and 0.0474 over the 471 called races. The best of the other models, Silver Bulletin, scored 0.0410 and 0.0336. The forecast favorite lost or trails in 36 races, and a Democrat won or leads every one of them. Forecast margins were 6.3 points too Republican on average.
One national shift explains 52% of the squared margin error. State effects explain 14% and race-level error 35%. Every source missed in the same direction. Our forecast was 1.5 points more Republican than the other models' average in the House and 1.7 points in governor races. With one fitted shift removed from every source, our Brier score ranks 5th of 7, so the ordering of races was ordinary for the field.
Three things held up under the same scrutiny as the failures. The seat distributions were wide enough: the results sit 1.3 standard deviations above our House mean and 1.2 above our Senate mean, inside the 95% intervals, where a model with independent races would have put the House result 5.7 standard deviations out. The Senate model beat every simple baseline (Brier 0.058 against 0.092 for presidential lean plus the generic ballot). In the 247 Republican-held seats our margins were closer than the average of the other models (mean absolute error 6.74 against 6.92).
The House model did not beat a two-line baseline. Presidential lean plus the generic ballot scored a Brier of 0.0512 against our 0.0509, with a lower margin error (6.58 against 7.45 points). Three poll-handling choices each moved the forecast toward Republicans in a year when the polls already understated Democrats: the poll-bias shift, the partisan-sponsor adjustment and the 60-day poll half-life. The 80% intervals contained 61% of results. The fixes that would have repaired 2026 made 2012 to 2024 worse in the backtest that has been run, and this report does not recommend adopting them on the strength of one election.
1. Scope
The report answers four questions. How accurate was the final forecast, and against whom? Did the model add anything to what simple rules already give? Which components helped, which hurt and which made no difference? What can and cannot be concluded from one election?
It covers the 506 races the final edition forecast: 35 Senate, 36 governor and 435 House. State legislative and down-ballot races are outside its scope.
The first postmortem (docs/postmortem-2026/SCORECARD.md, DIAGNOSIS.md, FIXES.md and BACKTEST.md, written November 7) established the ranking, a diagnosis and a backtest of proposed fixes. This report reuses its data loaders, recomputes every number on a later results snapshot, and adds the baselines, the component decomposition, the variance decomposition and the search for what worked. Where a number here differs from the November 7 documents, the cause is the later count unless stated.
Signs follow one convention throughout. Margins are Democratic minus Republican in points. An error is the forecast minus the result, so a negative error means the forecast was too Republican.
2. Data and methods
2.1 The forecast that is scored
The forecast is edition ctm-2.2-20261103-4b0dfb7f0237 of CTMM 2.2 (variant expert_free_22), activated at 16:38 UTC on November 3, 2026, before the 12:00 Eastern freeze, and still the active edition on the data branch. Race probabilities and all-vote margins come from the capture of the public API at 17:09 UTC that the scorecard used. Two-party centers, their parts, the poll lists, the intervals and the joint simulation draws are read from the edition's own files on the forecast-data branch.
CTMM 2.2 builds each race's two-party margin in stages: a structural prior fitted on past cycles, a national-environment leg, race polls blended in by an evidence weight, and a calibration layer (a smooth compression for the Senate, a linear calibration called G1 for governors). Expert ratings and prediction-market prices do not enter any number. Fundraising is switched off in all three offices. A fitted distribution around the center gives the win probability and the intervals, and a joint simulation of 100,000 draws gives seat totals.
2.2 Results and races not yet called
Results are read from results/2026 on the forecast-data branch at commit 89c2edda03, committed November 13, 2026 at 22:39 UTC (index generated 22:39 UTC). The scripts export that commit once and read the export, so a rerun reads the same bytes.
At that commit 484 of the 506 races are called and 22 are not: 20 House, 1 Senate and 1 governor. The results index as a whole lists 653 races, and the other races that are not yet called are down-ballot offices outside this report.
A race that is not called takes the leader of the count at the pinned commit as its outcome. Every headline number is also shown for called races alone, and section 3.2 shows a harsher test in which every uncalled race within one point flips. Two races are handled differently. Louisiana's 5th and 6th districts held all-party primaries on November 3 and go to runoffs on December 12, as the results files state. A Democrat leads each first round with under 20% of the vote, while Republican candidates together took 63% and 57% of it. A first-round plurality is not a result, so both races are left out of every score and counted for neither party in seat totals. Alaska's ranked-choice races are scored by the first-choice leader.
Table 1. The race universe at the pinned results commit. A race is scored on probability if it had a Republican and at least one other candidate. The two-party panel is the set used for margin decompositions: a Democrat against a Republican, published as a two-way race, with under 15% of the vote for others.
| Office | Forecast | Called | Not called | No Republican-versus-other contest | Runoff pending | Scored (probability) | of which called | Margin panel (all-vote) | Two-party panel |
|---|---|---|---|---|---|---|---|---|---|
| Senate | 35 | 34 | 1 | 0 | 0 | 35 | 34 | 31 | 29 |
| Governor | 36 | 35 | 1 | 0 | 0 | 36 | 35 | 34 | 31 |
| House | 435 | 415 | 20 | 18 | 2 | 415 | 403 | 413 | 411 |
| All three | 506 | 484 | 22 | 18 | 2 | 486 | 472 | 478 | 471 |
Margins use the votes counted at the pinned commit. Of the 481 races with an estimate of the share counted, 202 are at 98% or more, and the median is 97.7%. Margins will move as counting finishes. The first postmortem found that projecting incomplete counts to their end changed mean errors by 0.1 to 0.3 points.
2.3 Other forecasters
Other forecasters' numbers are the captures made on November 3 for the site's comparison page, held outside the repository in the forecaster-review workspace: twelve models. Prediction markets were captured too and are not ranked here: a market price is a price, not a forecast. Each source's final forecast is its last capture before 23:00 UTC (6 p.m. Eastern), the rule the capture log set before the election. Appendix C lists every source with its capture time and its own last-update stamp. The first postmortem checked that freezing every source at our own 17:00 UTC cutoff leaves our rank unchanged on every race set.
Sources differ in coverage. Seven sources, ours among them, cover all three offices in full. Others publish the Senate alone, or the Senate and House without governors. Comparisons therefore use common race sets: for each office, the sources that cover at least 99% of the scored races and the races all of them forecast.
Silver Bulletin's scores come from its subscriber forecasts, as we captured them on November 3. Its forecast is published for paying subscribers and its race-by-race numbers are not ours to redistribute, so this report prints the scores we computed from them and none of its race-by-race probabilities or margins.
2.4 Metrics
All probability metrics use P(Republican wins), the one probability every source publishes on the same terms, because some sources place an independent in the Democratic column.
| Metric | Definition |
|---|---|
| Brier score | The mean of (p − y) squared, where y is 1 if the Republican won. Lower is better. A forecast of 50% everywhere scores 0.25. |
| Log loss | The mean of −log of the probability given to what happened, with probabilities clipped at 0.1% and 99.9%. |
| Wrong calls | Races where the side given more than 50% lost. An exact 50% counts as half. |
| Discrimination (AUC) | The probability that a randomly chosen Republican win was given a higher P(R) than a randomly chosen Republican loss. It measures ordering and ignores level. |
| Calibration | The share of events that happened among forecasts of a given probability. The Murphy decomposition splits the Brier score into reliability (the calibration error), resolution (how far the forecast separates outcomes) and the uncertainty of the outcomes. |
| Log-odds shift | The single number that, added to every race's log-odds, minimizes that source's log loss. It is fitted to the results, one parameter per source. The Brier score after the shift shows what is left when a source's overall lean is removed. |
| Margin error | Forecast minus actual margin. Mean error is the signed bias. MAE is the mean absolute error. The MAE after removing a source's own mean error measures race-level accuracy. |
| Rank correlation | Spearman's correlation between forecast and actual margins. |
| Interval coverage | The share of actual two-party margins inside our 50%, 80% and 95% intervals. |
| Seat-distribution coverage | Where the actual seat count falls in the published simulated distribution. |
Comparisons with other sources use all-vote margins as each source published them. Decompositions of our own forecast use two-party margins, because the model's center and its parts are two-party quantities.
Intervals on differences between two sources are paired bootstraps that resample whole states, 10,000 draws, 90% level. Races share one national error, so even these intervals are narrower than the true uncertainty about which forecaster is better in general.
2.5 Reproducibility
Every number in this text is filled in by the build script from the data files that the analysis scripts write. Appendix B gives the scripts, the pinned commits and the seeds.
3. Performance against other forecasters
3.1 Probabilities
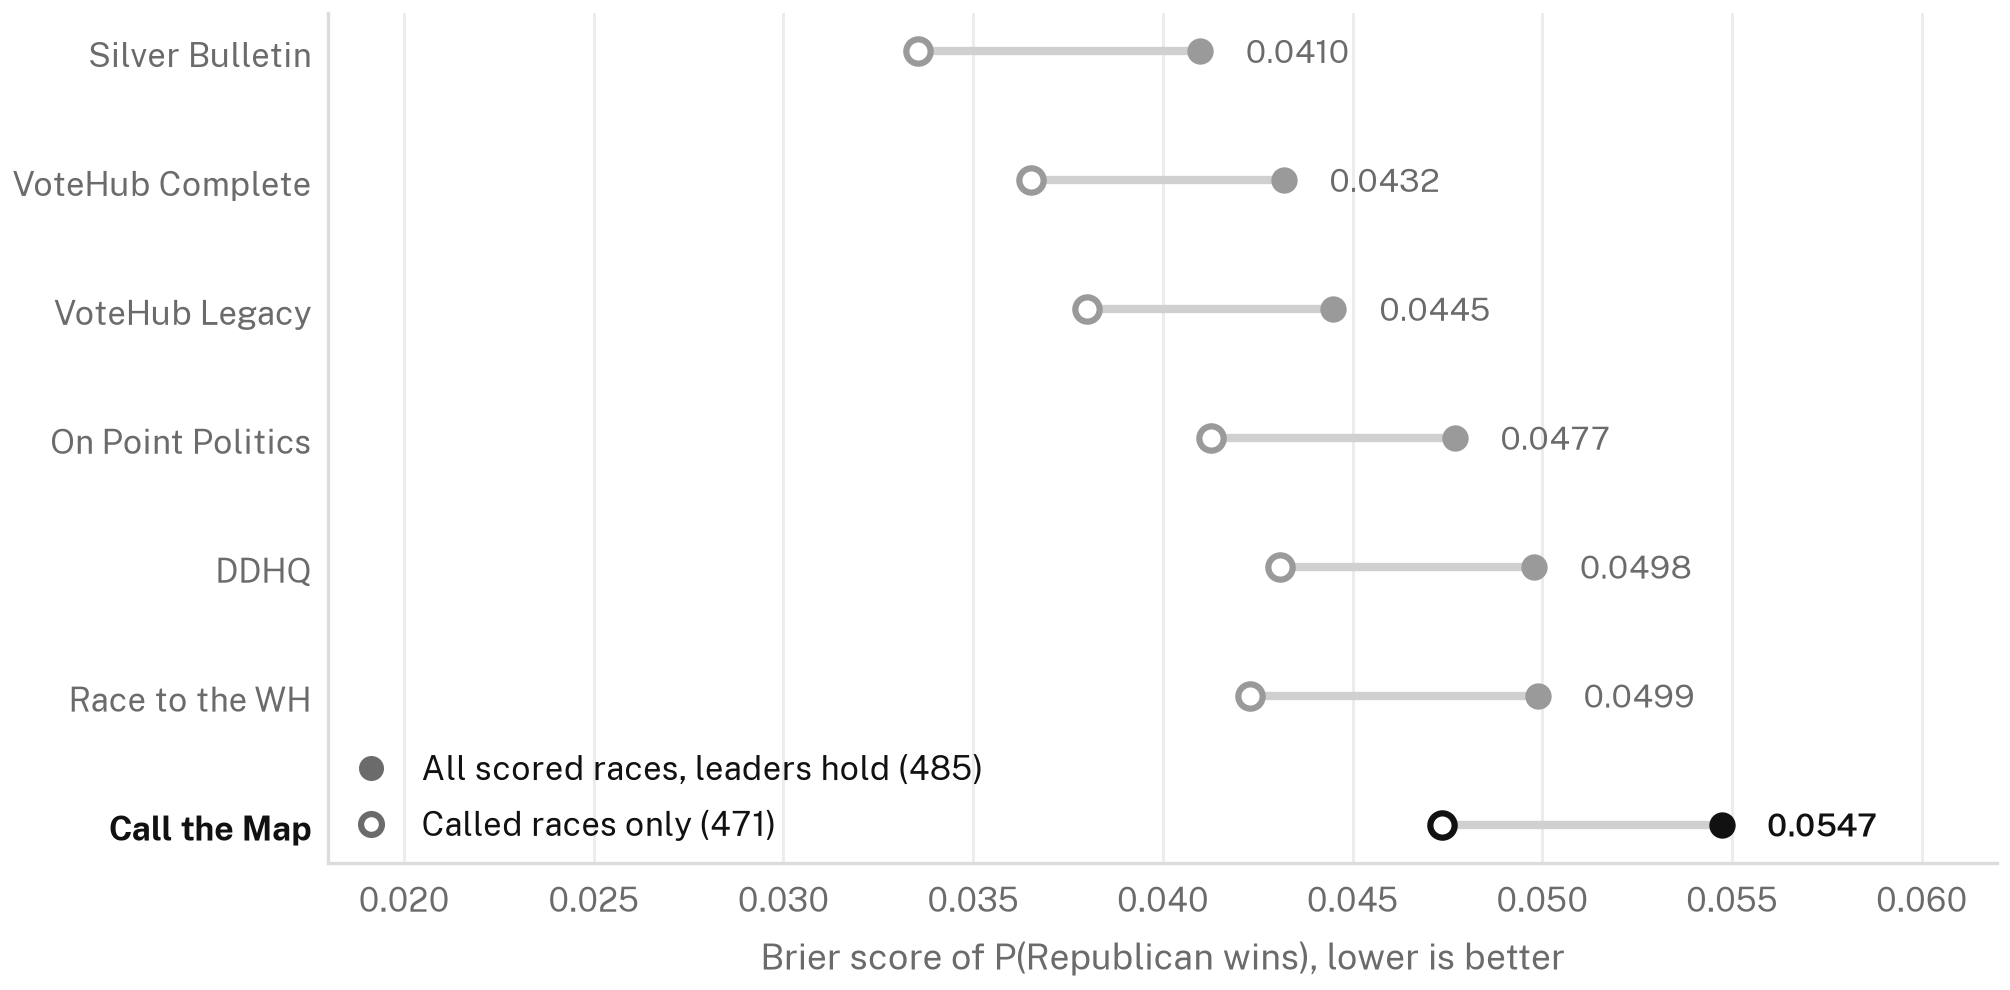
Table 2. Probability scores on the all-office common set (7 sources). The log-odds shift is negative when a source was too Republican.
| Source | Brier, leaders hold (485) | Rank | Brier, called only (471) | Rank | Log loss | Wrong calls | AUC | Log-odds shift | Brier after shift | Rank |
|---|---|---|---|---|---|---|---|---|---|---|
| Silver Bulletin | 0.0410 | 1 | 0.0336 | 1 | 0.1412 | 26 | 0.9925 | −1.28 | 0.0322 | 3 |
| VoteHub Complete | 0.0432 | 2 | 0.0365 | 2 | 0.1378 | 31 | 0.9950 | −1.31 | 0.0297 | 1 |
| VoteHub Legacy | 0.0445 | 3 | 0.0380 | 3 | 0.1406 | 34 | 0.9948 | −1.28 | 0.0309 | 2 |
| On Point Politics | 0.0477 | 4 | 0.0413 | 4 | 0.1633 | 29 | 0.9863 | −0.19 | 0.0474 | 7 |
| DDHQ | 0.0498 | 5 | 0.0431 | 6 | 0.1642 | 34.5 | 0.9912 | −0.85 | 0.0400 | 6 |
| Race to the WH | 0.0499 | 6 | 0.0423 | 5 | 0.1744 | 31.5 | 0.9901 | −1.24 | 0.0362 | 4 |
| Call the Map | 0.0547 | 7 | 0.0474 | 7 | 0.1769 | 36 | 0.9905 | −1.27 | 0.0378 | 5 |
Our forecast is last on the Brier score and on log loss under both outcome rules, and it has the most wrong calls (36 of 485; 31 of 471 among called races). The gap to Silver Bulletin, the best of the other models, is 0.0137 (0.0090 to 0.0192).
The bottom of the table is a cluster. Our gap to DDHQ is 0.0049 (interval −0.0003 to +0.0113), to Race to the WH 0.0048 (+0.0007 to +0.0092) and to On Point Politics 0.0070 (−0.0009 to +0.0156). Two of those three intervals include zero.
Table 3. Our scores and ranks by office, under both outcome rules.
| Office | Outcome rule | Races | Sources | Our Brier | Rank | Best source | Our log loss | Rank | Our wrong calls | Our AUC | Rank | Our Brier after shift | Rank |
|---|---|---|---|---|---|---|---|---|---|---|---|---|---|
| Senate | leaders hold | 35 | 12 | 0.0785 | 12 | On Point Politics 0.0437 | 0.2452 | 10 | 3 | 0.9930 | 1 | 0.0410 | 4 |
| Senate | called only | 34 | 12 | 0.0739 | 11 | On Point Politics 0.0432 | 0.2329 | 10 | 3 | 0.9927 | 1 | 0.0411 | 4 |
| Governor | leaders hold | 36 | 8 | 0.0767 | 8 | On Point Politics 0.0251 | 0.2338 | 8 | 5 | 0.9965 | 5 | 0.0389 | 6 |
| Governor | called only | 35 | 8 | 0.0784 | 8 | On Point Politics 0.0257 | 0.2364 | 8 | 5 | 0.9964 | 5 | 0.0400 | 6 |
| House | leaders hold | 414 | 9 | 0.0508 | 9 | Silver Bulletin 0.0395 | 0.1662 | 7 | 28 | 0.9904 | 8 | 0.0374 | 7 |
| House | called only | 402 | 9 | 0.0424 | 8 | Silver Bulletin 0.0310 | 0.1371 | 7 | 23 | 0.9950 | 8 | 0.0294 | 7 |
| All three | leaders hold | 485 | 7 | 0.0547 | 7 | Silver Bulletin 0.0410 | 0.1769 | 7 | 36 | 0.9905 | 5 | 0.0378 | 5 |
| All three | called only | 471 | 7 | 0.0474 | 7 | Silver Bulletin 0.0336 | 0.1514 | 7 | 31 | 0.9945 | 6 | 0.0311 | 5 |
With leaders holding, the picture by office is the same on the Brier score: last in the Senate, last among governor forecasts and last in the House. On called races alone we are 11th of 12 in the Senate, 8th of 8 among governor forecasts and 8th of 9 in the House. Governor races were the weakest office per race, with 5 wrong calls in 36.
The Senate set is small, 35 races, and ranks in it move with single results. Adding the one Senate race not yet called moves us from 11th of 12 to 12th of 12. Mississippi is the plainest case: the Democrat won there, and 11 of the 11 models that forecast the race favored the Republican. Senate ranks between the top and the bottom should be read as provisional.
The AUC column shows that discrimination was high for every source and that ours was not distinctive: 0.9905, 5th of 7. The Murphy decomposition says the same thing in other terms. Our resolution was 0.2046 (6th of 7) and our reliability error 0.0187 (7th of 7, where 1st is the smallest error).
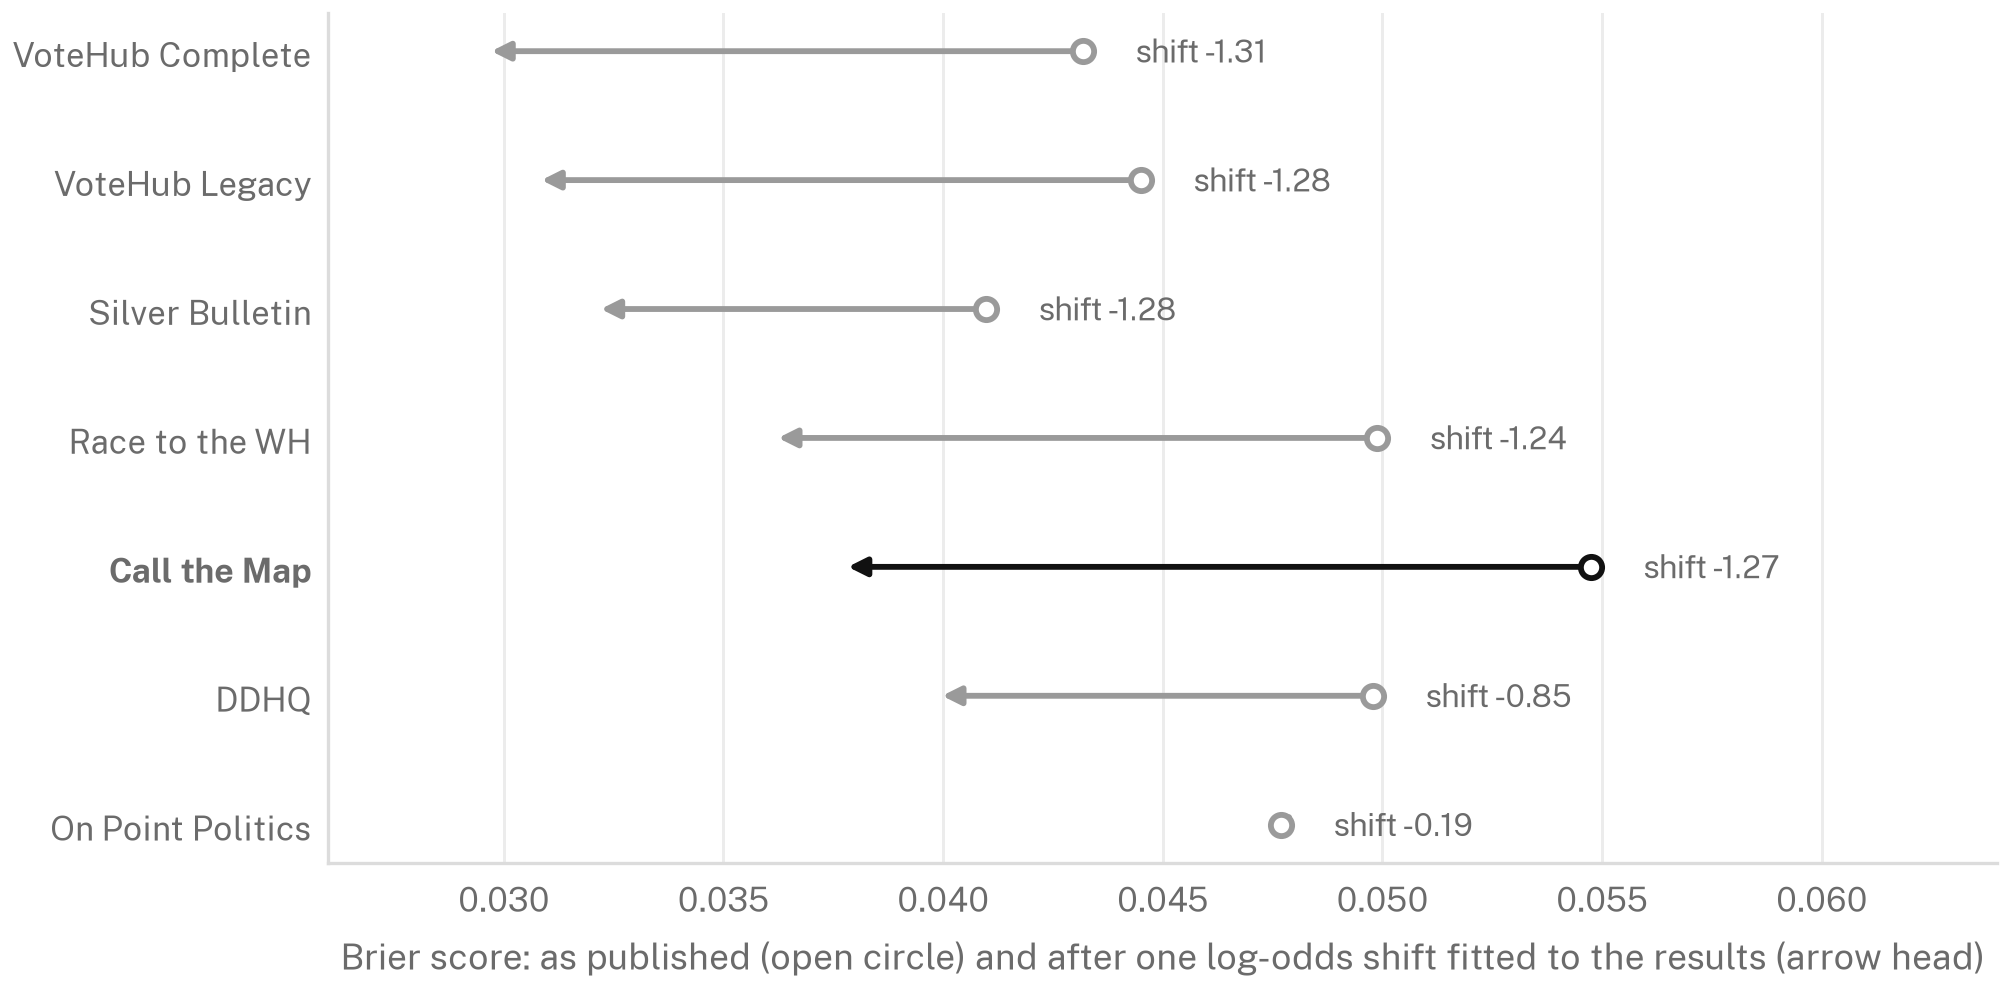
Every source needs a negative shift. Ours is −1.27 on the log-odds scale, close to Silver Bulletin's −1.28, the two VoteHub models' and Race to the WH's. On Point Politics needed almost none (−0.19). After the shift our Brier score is 0.0378, 5th of 7 (5th of 7 on called races). Removing the shared lean lifts us off the bottom and leaves us below the middle. The forecast's problem was its level first and its race-level content second.
3.2 Sensitivity to races not yet called
Table 4. Our headline scores under four treatments of the races that are not called. The close-race flip reverses the outcome of the 8 uncalled races whose current margin is under one point.
| Treatment of races not called | Races | Our Brier | Our rank | Our wrong calls | Our log loss | Next-to-last source | Best model | Best source |
|---|---|---|---|---|---|---|---|---|
| Called races only | 471 | 0.0474 | 7 of 7 | 31 | 0.1514 | 0.0431 (DDHQ) | 0.0336 (Silver Bulletin) | 0.0336 (Silver Bulletin) |
| Leaders hold (headline rule) | 485 | 0.0547 | 7 of 7 | 36 | 0.1769 | 0.0499 (Race to the WH) | 0.0410 (Silver Bulletin) | 0.0410 (Silver Bulletin) |
| Leaders hold, except every uncalled race within 1 point flips | 485 | 0.0524 | 7 of 7 | 34 | 0.1682 | 0.0476 (Race to the WH) | 0.0388 (Silver Bulletin) | 0.0388 (Silver Bulletin) |
| Leaders hold, and the two Louisiana first-round leaders count as winners | 487 | 0.0585 | 7 of 7 | 38 | 0.1951 | 0.0536 (Race to the WH) | 0.0449 (Silver Bulletin) | 0.0449 (Silver Bulletin) |
Our rank does not depend on the treatment. The level of every source's score does: uncalled races are close races, and adding 14 of them raises every Brier score by 16% or more. Assigning uncalled races to their leaders raises our wrong calls from 31 to 36. Appendix A lists every uncalled race with its current margin.
3.3 Margins
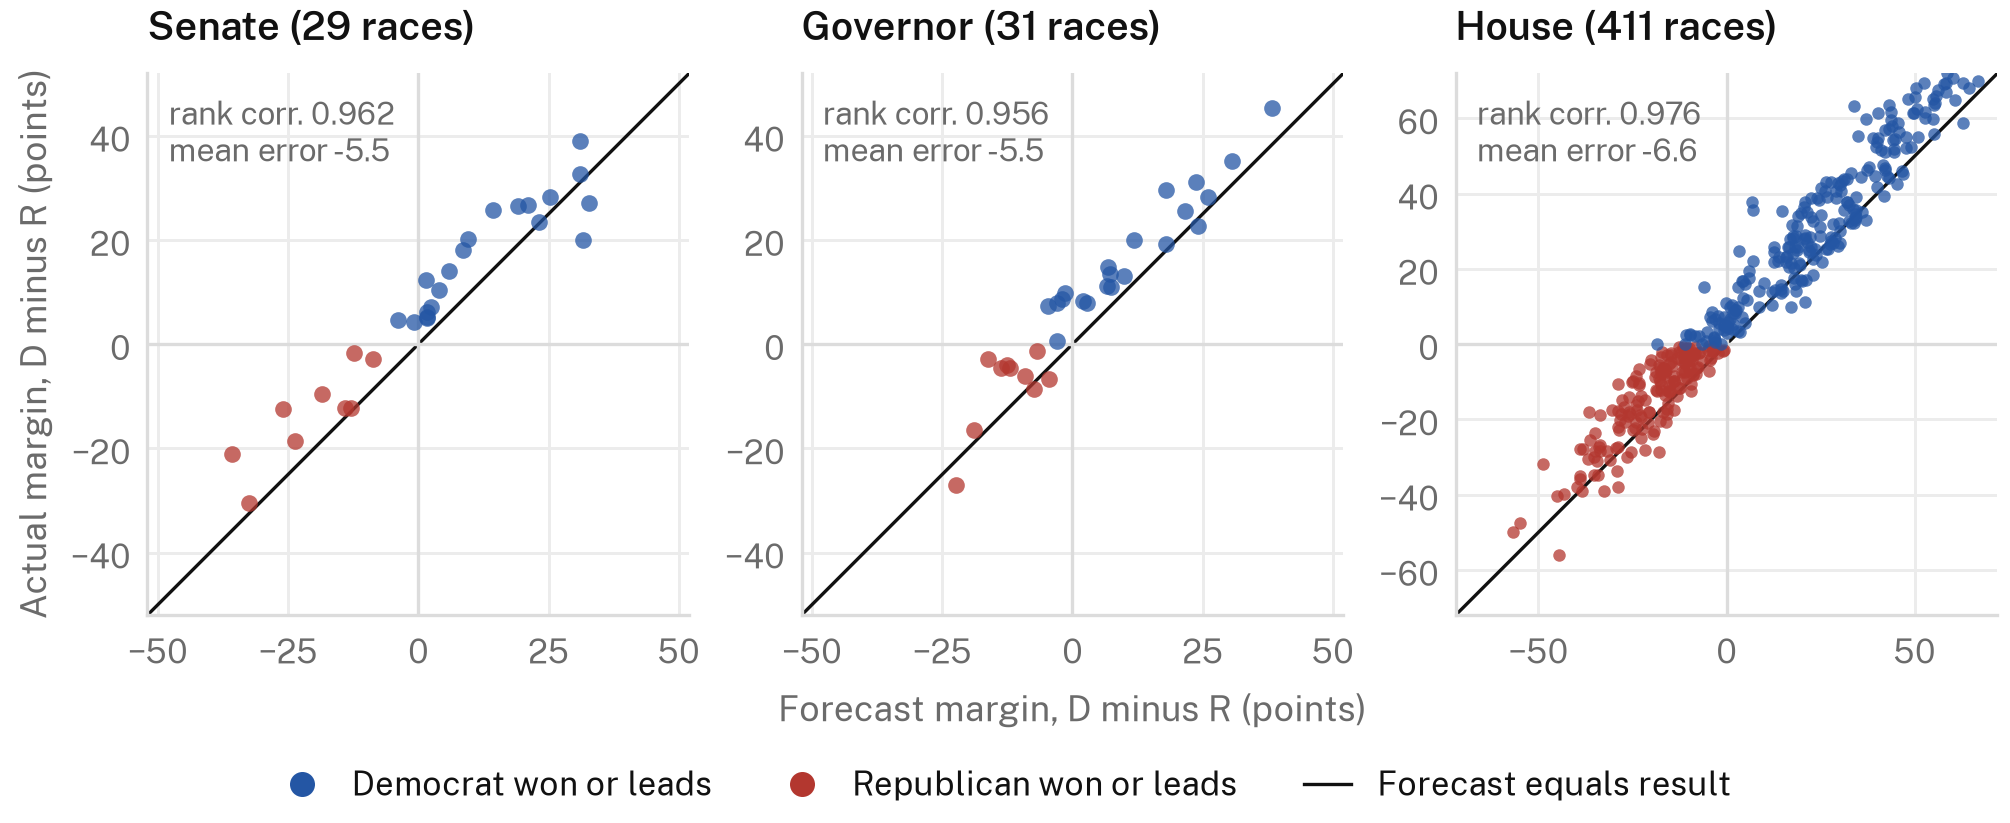
Table 5. Margin accuracy on the 477 races for which all seven margin-publishing all-office sources gave a margin (all-vote margins as published).
| Source | Mean error | MAE | RMSE | MAE after removing own mean error | Rank | Rank correlation (Spearman) | Rank | Races too Republican |
|---|---|---|---|---|---|---|---|---|
| On Point Politics | −1.5 | 5.00 | 6.51 | 4.89 | 6 | 0.9771 | 4 | 61% |
| VoteHub Complete | −5.1 | 6.08 | 7.36 | 4.07 | 1 | 0.9848 | 1 | 86% |
| VoteHub Legacy | −5.1 | 6.08 | 7.37 | 4.08 | 2 | 0.9847 | 2 | 85% |
| Silver Bulletin | −5.1 | 6.31 | 7.83 | 4.67 | 3 | 0.9785 | 3 | 83% |
| Call the Map | −6.3 | 7.12 | 8.70 | 4.79 | 4 | 0.9761 | 6 | 85% |
| DDHQ | −6.4 | 7.25 | 8.88 | 4.80 | 5 | 0.9752 | 7 | 87% |
| Race to the WH | −6.9 | 8.14 | 10.08 | 5.89 | 7 | 0.9768 | 5 | 83% |
Our margins were 6.28 points too Republican on average, with a mean absolute error of 7.12 points, 5th of 7. DDHQ and Race to the WH were further off. On Point Politics had by far the smallest bias (−1.5) and the lowest MAE.
Race-level accuracy is the MAE after each source's own mean error is removed. Ours is 4.79 points, 4th of 7, behind the two VoteHub models (4.07) and Silver Bulletin (4.67). Our rank correlation between forecast and actual margins is 0.9761, 6th of 7. All seven sources are between 0.975 and 0.985. We ordered races about as well as the field did. We did not order them better.
Table 6. Our margin accuracy by office on each office's common set.
| Set | Races | Sources | Our mean error | Our MAE | Rank | Lowest MAE | Our MAE after removing mean | Rank | Our rank correlation | Rank | Highest rank correlation |
|---|---|---|---|---|---|---|---|---|---|---|---|
| Senate | 31 | 11 | −5.4 | 6.43 | 9 | On Point Politics 3.44 | 3.99 | 10 | 0.9734 | 8 | VoteHub Legacy 0.9810 |
| Governor | 34 | 8 | −5.1 | 5.83 | 6 | On Point Politics 3.98 | 3.59 | 5 | 0.9664 | 3 | Silver Bulletin 0.9722 |
| House | 412 | 9 | −6.4 | 7.28 | 7 | On Point Politics 5.21 | 4.94 | 6 | 0.9762 | 9 | VoteHub Complete 0.9848 |
| Senate+House | 443 | 9 | −6.4 | 7.22 | 7 | On Point Politics 5.08 | 4.88 | 7 | 0.9762 | 9 | VoteHub Complete 0.9850 |
| All three | 477 | 7 | −6.3 | 7.12 | 5 | On Point Politics 5.00 | 4.79 | 4 | 0.9761 | 6 | VoteHub Complete 0.9848 |
3.4 Chamber control and seats
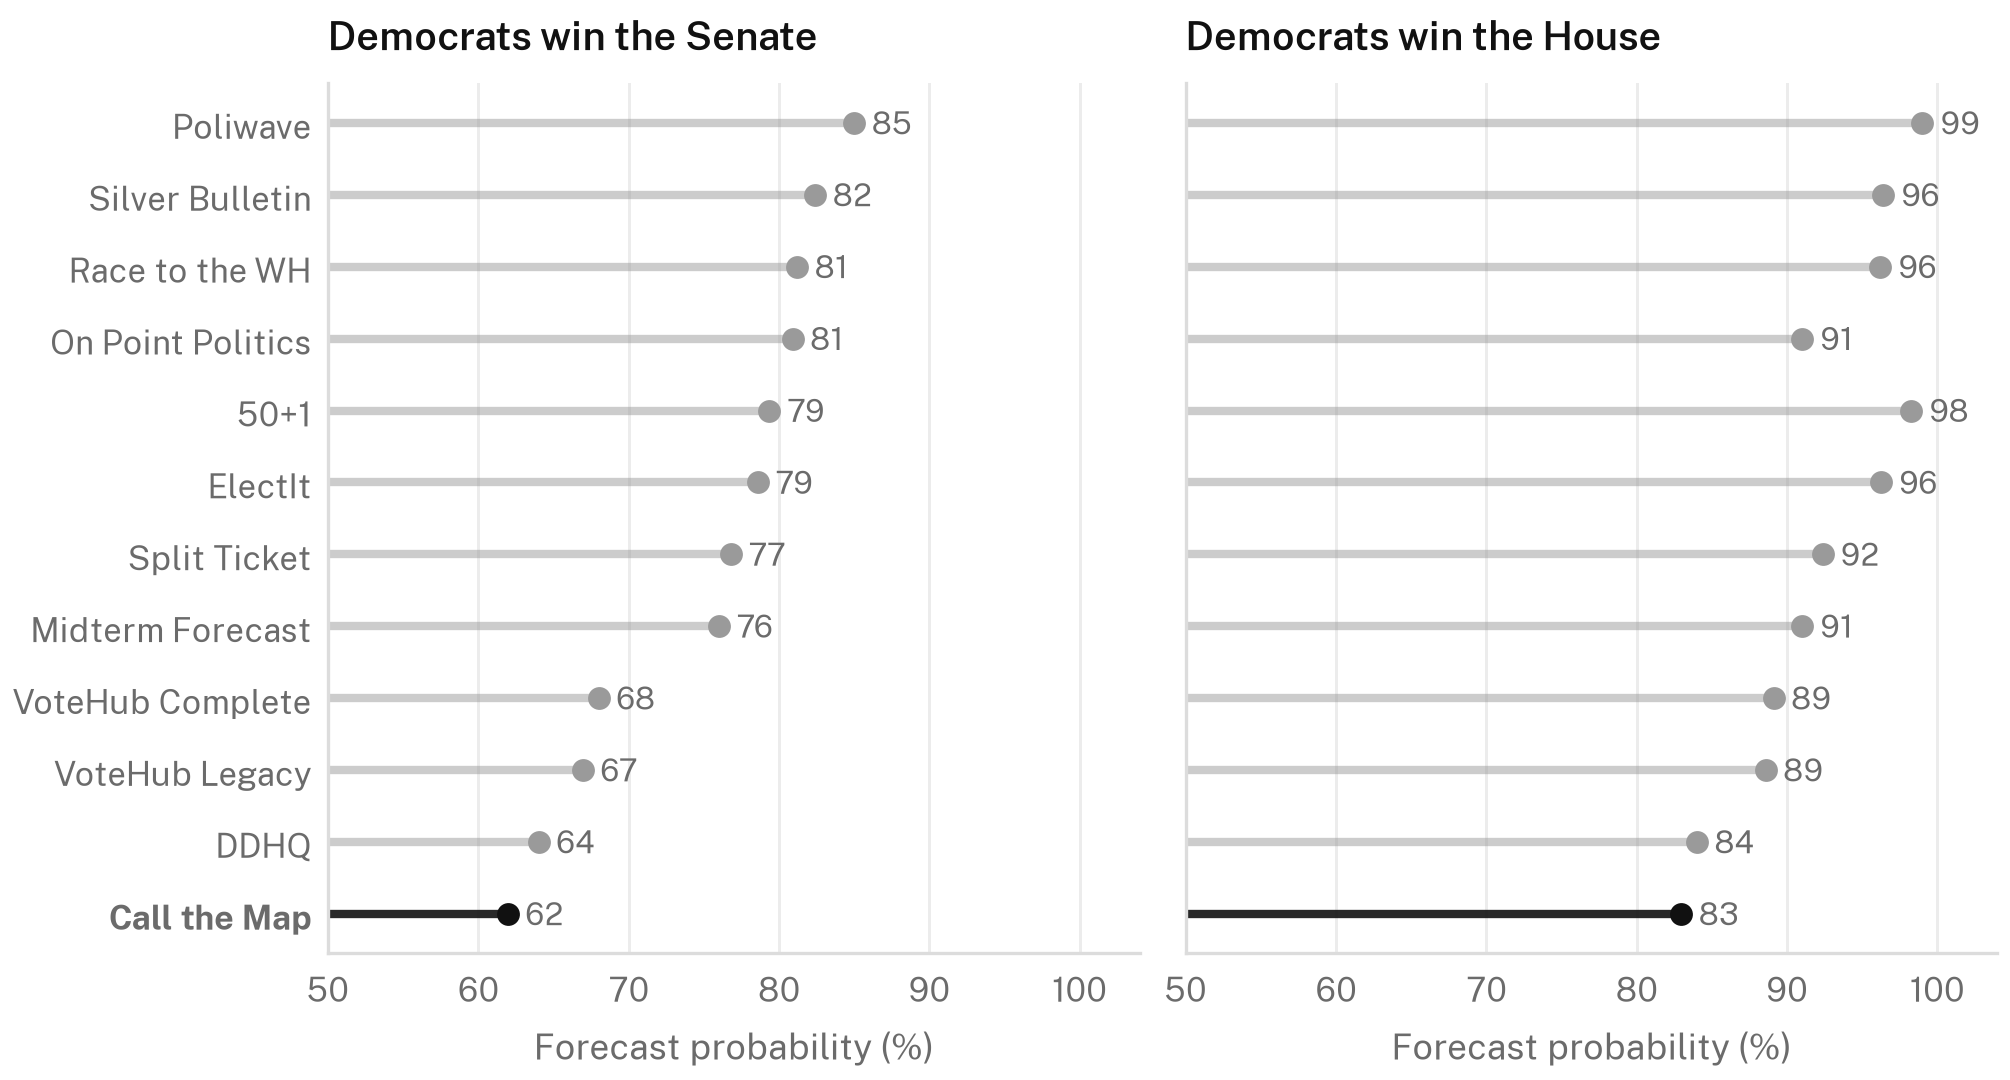
Table 7. Chamber-control probabilities.
| Source | P(Democrats win the Senate) | P(Democrats win the House) | Mean Brier of the two |
|---|---|---|---|
| Poliwave | 85% | 99% | 0.011 |
| Silver Bulletin | 82% | 96% | 0.016 |
| Race to the WH | 81% | 96% | 0.018 |
| On Point Politics | 81% | 91% | 0.022 |
| 50+1 | 79% | 98% | 0.021 |
| ElectIt | 79% | 96% | 0.024 |
| Split Ticket | 77% | 92% | 0.030 |
| Midterm Forecast | 76% | 91% | 0.033 |
| VoteHub Complete | 68% | 89% | 0.057 |
| VoteHub Legacy | 67% | 89% | 0.061 |
| DDHQ | 64% | 84% | 0.078 |
| Call the Map | 62% | 83% | 0.087 |
Both chambers went Democratic, and we gave that the lowest probability of any source in both: 61.9% for the Senate and 83.0% for the House.
Table 8. Seat results against our published seat distributions (100,000 simulations). The House result counts called seats and current leaders and leaves out the two Louisiana runoff seats.
| Chamber | Result if leaders hold | Range while uncalled | Our median | Our mean | Our 80% interval | Our 95% interval | Our P(at or above result) | Result in SDs above our mean | 80% interval if races were independent | SDs if independent | Our P(D control) |
|---|---|---|---|---|---|---|---|---|---|---|---|
| Senate, Democratic-aligned seats of 100 | 56 | 55 to 56 | 52 | 51.6 | 47 to 56 | 44 to 58 | 14.8% | 1.19 | 49 to 54 | 2.5 | 61.9% |
| House, Democratic seats of 435 | 260 | 250 to 270 | 234 | 235.5 | 212 to 260 | 203 to 276 | 10.5% | 1.30 | 231 to 241 | 5.7 | 83.0% |
| Governors, Democratic wins of 36 | 24 | 23 to 24 | 19 | 19.6 | 15 to 24 | 12 to 27 | 14.1% | 1.21 | 18 to 22 | 2.5 | n/a |
Our medians were low by 4 Senate seats, 26 House seats and 5 governorships. Each result is at the top edge of our 80% interval and inside the 95% interval. Section 6.1 returns to why that matters.
Every source was low on seats. Summing each source's race probabilities gives an expected Democratic House count of 236 for us, 241 for Silver Bulletin, 255 for On Point Politics, against 260. Race to the WH was lower than us at 234.
4. Performance against simple baselines
A model earns its complexity only where it beats a rule that needs no model. Five baselines were computed for this report from information available before the election.
- The 2024 presidential margin in the state or district, unchanged.
- Presidential lean plus the generic ballot: the 2024 presidential margin relative to the nation, plus the generic-ballot average the model itself consumed (D+8.32).
- Previous result plus uniform swing: the seat's last result, plus the generic ballot minus the national House margin of the year of that result. Where the previous race was uncontested the rule falls back to presidential lean plus the generic ballot. For redrawn House districts the previous result is the model's own reconstruction on the new lines.
- The plain average of a race's admitted polls, in polled races only.
- The model's own structural prior, alone and with its environment leg.
The first three need a probability, so each uses a normal distribution whose standard deviation is the root-mean-square error of the same rule on the model's historical rows from 2014 to 2024 (House 9.9 points for presidential lean plus the generic ballot, Senate 10.5, governor 20.1). Nothing from 2026 enters those widths. The poll average and the prior arms keep each race's published interval. All rows are scored on the two-party panel with leaders holding. The mean of the other model forecasters is shown for scale. It is not a baseline we could have computed alone.
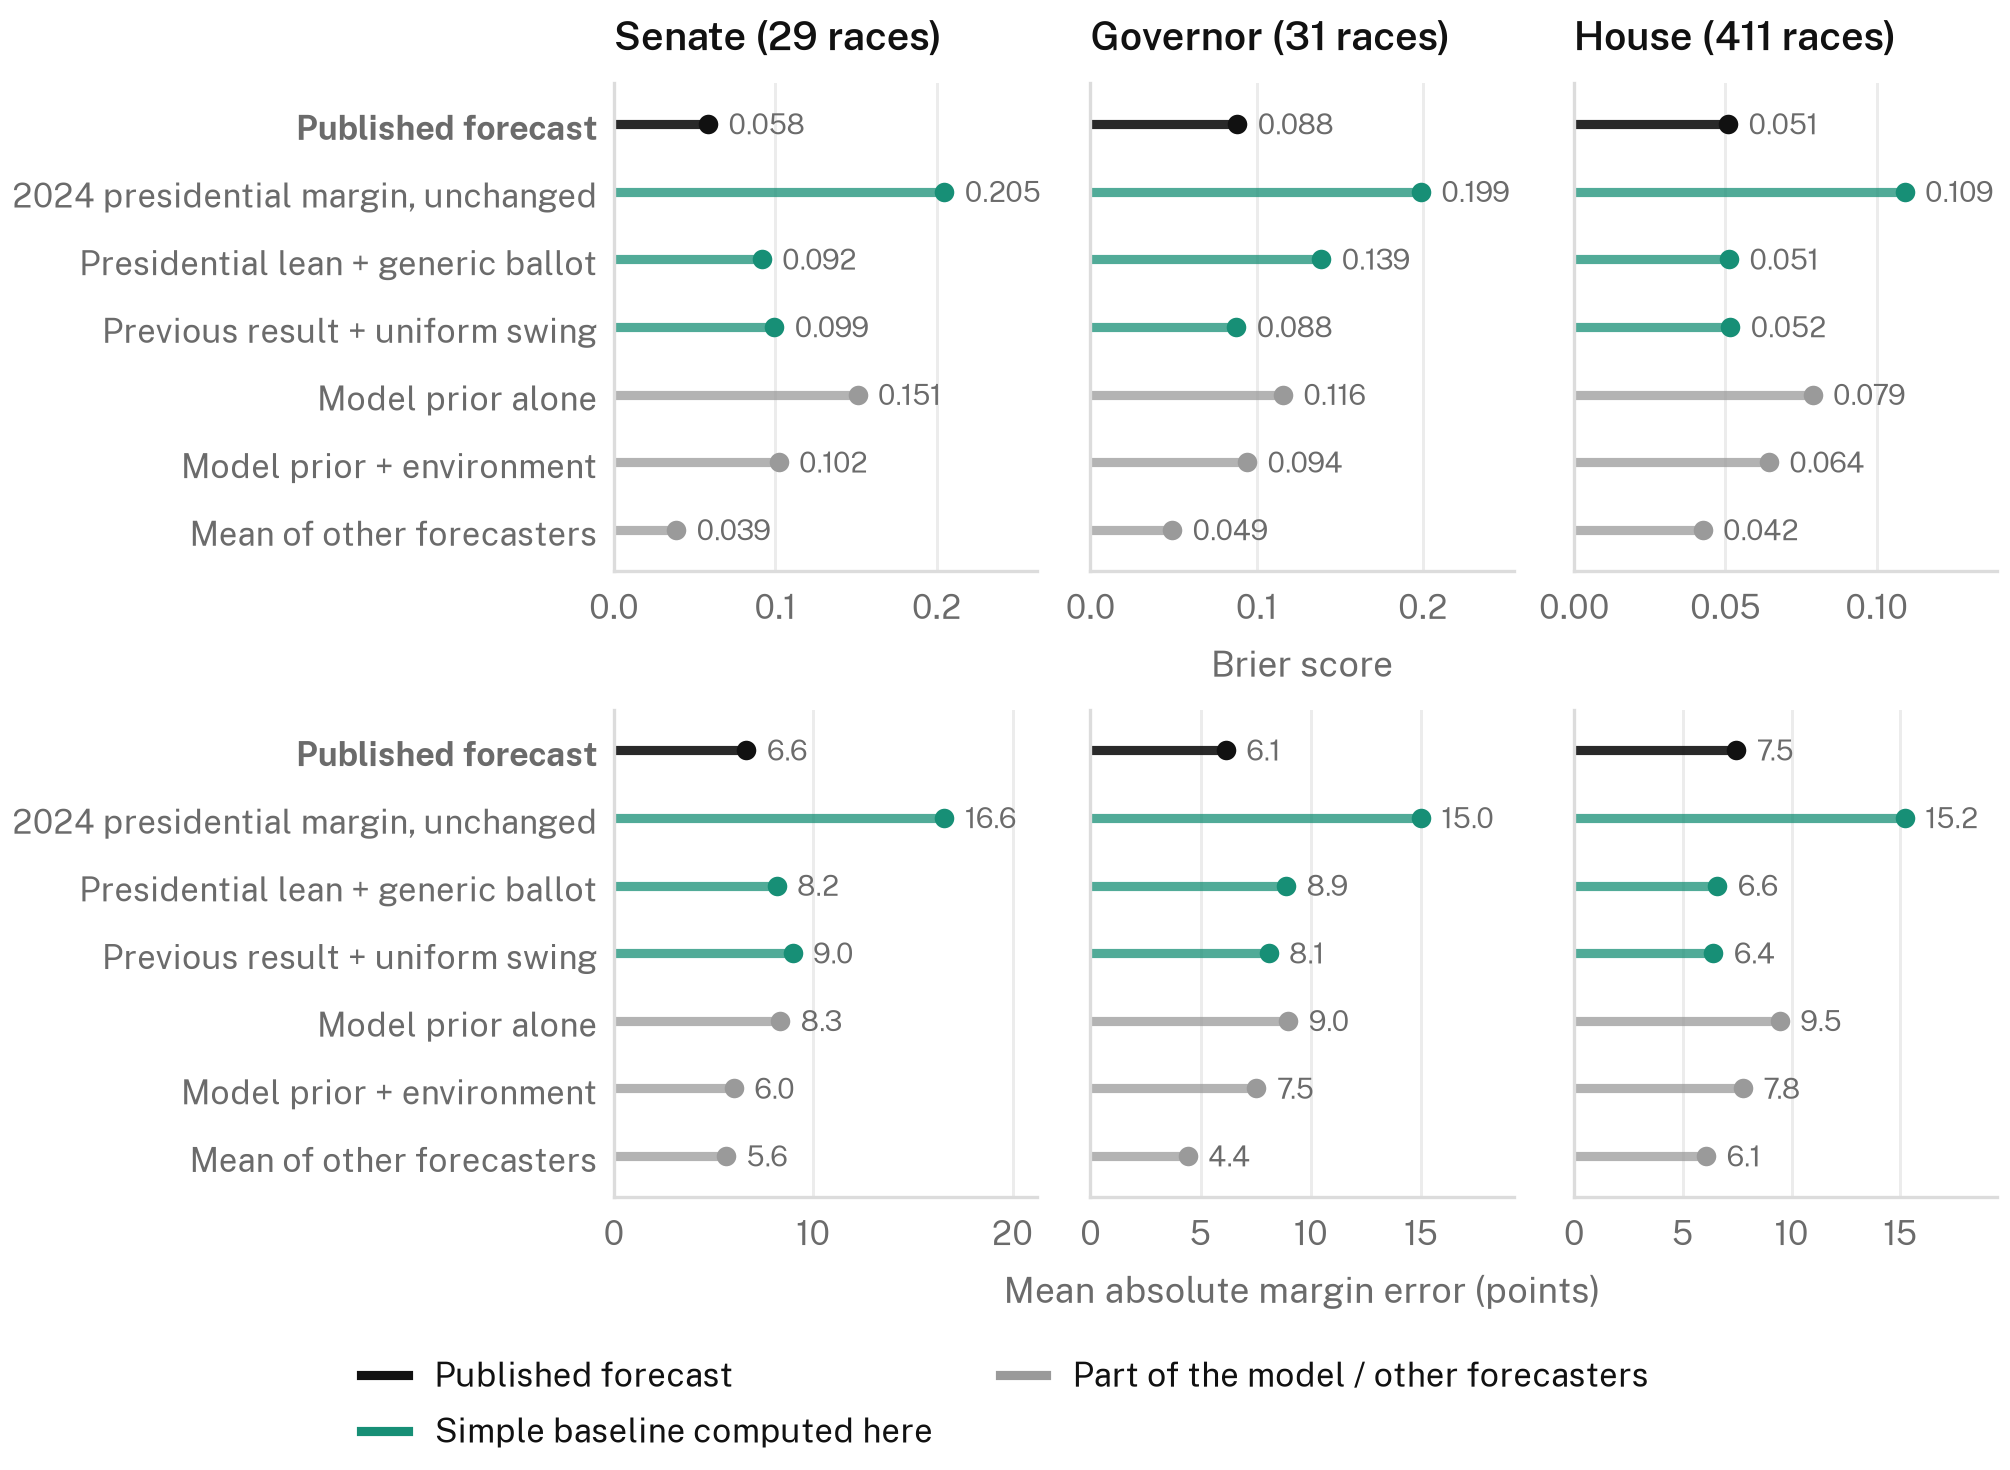
Table 9. Senate: baselines against the published forecast on the same races. The interval is a state-clustered bootstrap of our Brier minus the rule's; a negative value means we were better.
| Rule | Races | Brier | Ours, same races | Ours minus rule [90% interval] | Wrong calls | Ours | MAE | Ours | Mean error | Rank corr. | Ours |
|---|---|---|---|---|---|---|---|---|---|---|---|
| Published forecast | 29 | 0.0584 | 0.0584 | 2 | 2 | 6.65 | 6.65 | −5.5 | 0.962 | 0.962 | |
| 2024 presidential margin, unchanged | 29 | 0.2049 | 0.0584 | −0.1465 [−0.2185, −0.0789] | 8 | 2 | 16.58 | 6.65 | −16.6 | 0.915 | 0.962 |
| Presidential lean plus generic ballot | 29 | 0.0916 | 0.0584 | −0.0333 [−0.0653, −0.0048] | 5 | 2 | 8.16 | 6.65 | −6.6 | 0.915 | 0.962 |
| Previous result plus uniform swing | 29 | 0.0995 | 0.0584 | −0.0411 [−0.0718, −0.0124] | 5 | 2 | 8.96 | 6.65 | −7.6 | 0.907 | 0.962 |
| Model prior alone | 29 | 0.1510 | 0.0584 | −0.0927 [−0.1624, −0.0321] | 6 | 2 | 8.34 | 6.65 | −8.1 | 0.955 | 0.962 |
| Model prior plus environment leg | 29 | 0.1021 | 0.0584 | −0.0437 [−0.0973, −0.0005] | 6 | 2 | 6.01 | 6.65 | −4.7 | 0.955 | 0.962 |
| Plain poll average (polled races) | 24 | 0.0570 | 0.0705 | +0.0135 [−0.0078, +0.0346] | 1 | 2 | 6.08 | 6.50 | −5.6 | 0.977 | 0.973 |
| Mean of other model forecasters | 29 | 0.0386 | 0.0584 | +0.0198 [+0.0090, +0.0316] | 1 | 2 | 5.61 | 6.49 | −5.0 | 0.981 | 0.970 |
In the Senate the model beat every baseline clearly. Its Brier score was 0.0584 against 0.0916 for presidential lean plus the generic ballot and 0.0995 for previous result plus swing, and both intervals exclude zero. It made 2 wrong calls where those rules made 5. Its margin error was lower (6.65 against 8.16 points) and its ordering better (rank correlation 0.962 against 0.915). The whole gain comes from race polls: the prior with its environment leg scores 0.1021, worse than the baselines.
Table 10. Governors: baselines against the published forecast.
| Rule | Races | Brier | Ours, same races | Ours minus rule [90% interval] | Wrong calls | Ours | MAE | Ours | Mean error | Rank corr. | Ours |
|---|---|---|---|---|---|---|---|---|---|---|---|
| Published forecast | 31 | 0.0884 | 0.0884 | 5 | 5 | 6.14 | 6.14 | −5.5 | 0.956 | 0.956 | |
| 2024 presidential margin, unchanged | 31 | 0.1989 | 0.0884 | −0.1106 [−0.1742, −0.0511] | 12 | 5 | 14.99 | 6.14 | −11.7 | 0.721 | 0.956 |
| Presidential lean plus generic ballot | 31 | 0.1390 | 0.0884 | −0.0506 [−0.1207, +0.0146] | 6 | 5 | 8.87 | 6.14 | −1.7 | 0.721 | 0.956 |
| Previous result plus uniform swing | 31 | 0.0878 | 0.0884 | +0.0006 [−0.0560, +0.0578] | 3 | 5 | 8.08 | 6.14 | −2.1 | 0.891 | 0.956 |
| Model prior alone | 31 | 0.1158 | 0.0884 | −0.0275 [−0.0729, +0.0170] | 5 | 5 | 8.97 | 6.14 | −7.6 | 0.922 | 0.956 |
| Model prior plus environment leg | 31 | 0.0943 | 0.0884 | −0.0059 [−0.0453, +0.0345] | 4 | 5 | 7.53 | 6.14 | −5.6 | 0.922 | 0.956 |
| Plain poll average (polled races) | 30 | 0.0638 | 0.0913 | +0.0275 [+0.0051, +0.0523] | 2 | 5 | 5.70 | 6.11 | −4.0 | 0.951 | 0.952 |
| Mean of other model forecasters | 31 | 0.0491 | 0.0884 | +0.0392 [+0.0129, +0.0692] | 2 | 5 | 4.40 | 6.02 | −3.7 | 0.972 | 0.958 |
For governors the model's margins were better than any baseline's (6.14 points against 8.08 for previous result plus swing) and its ordering far better (rank correlation 0.956 against 0.891). Its probabilities were not. Previous result plus swing scored 0.0878 against our 0.0884, with 3 wrong calls against our 5. The baseline was less biased (−2.1 against −5.5), and in a year with a large one-sided miss a less biased rule wins on probability even with twice the scatter. The plain poll average did better than both: 0.0638 on 30 polled races, where our published forecast scored 0.0913.
Table 11. House: baselines against the published forecast.
| Rule | Races | Brier | Ours, same races | Ours minus rule [90% interval] | Wrong calls | Ours | MAE | Ours | Mean error | Rank corr. | Ours |
|---|---|---|---|---|---|---|---|---|---|---|---|
| Published forecast | 411 | 0.0509 | 0.0509 | 28 | 28 | 7.45 | 7.45 | −6.6 | 0.976 | 0.976 | |
| 2024 presidential margin, unchanged | 411 | 0.1093 | 0.0509 | −0.0584 [−0.0720, −0.0450] | 59 | 28 | 15.20 | 7.45 | −15.2 | 0.973 | 0.976 |
| Presidential lean plus generic ballot | 411 | 0.0512 | 0.0509 | −0.0003 [−0.0094, +0.0106] | 32 | 28 | 6.58 | 7.45 | −5.2 | 0.973 | 0.976 |
| Previous result plus uniform swing | 411 | 0.0516 | 0.0509 | −0.0007 [−0.0095, +0.0088] | 35 | 28 | 6.40 | 7.45 | −4.5 | 0.975 | 0.976 |
| Model prior alone | 411 | 0.0788 | 0.0509 | −0.0279 [−0.0390, −0.0175] | 44 | 28 | 9.46 | 7.45 | −9.1 | 0.974 | 0.976 |
| Model prior plus environment leg | 411 | 0.0644 | 0.0509 | −0.0135 [−0.0214, −0.0061] | 39 | 28 | 7.76 | 7.45 | −6.9 | 0.974 | 0.976 |
| Plain poll average (polled races) | 110 | 0.1441 | 0.1542 | +0.0101 [−0.0118, +0.0307] | 23 | 24 | 7.13 | 6.78 | −4.8 | 0.836 | 0.912 |
| Mean of other model forecasters | 411 | 0.0425 | 0.0509 | +0.0084 [+0.0048, +0.0126] | 24 | 28 | 6.07 | 7.30 | −5.1 | 0.984 | 0.976 |
In the House the model did not beat the two uniform-swing rules. Presidential lean plus the generic ballot scored 0.0512 and previous result plus swing 0.0516, against our 0.0509. Both intervals straddle zero. On margins both rules were better than the model: 6.58 and 6.40 points against 7.45. The reason is level. The rules pass the generic ballot through at full strength and ended 5.2 and 4.5 points too Republican, where the model ended 6.6 points too Republican. With each rule's own mean error removed, the model and presidential lean plus the generic ballot are tied at 5.06 and 5.06 points, and the rank correlations are 0.9760 and 0.9731.
The House model's prior does carry information that the raw presidential margin lacks. The unchanged 2024 margin scores 0.1093 with 59 wrong calls. What the model's 28 structural features, its environment leg and its district polls added over a uniform swing from the generic ballot was, in 2026, nothing measurable in aggregate. The model made fewer wrong calls than the two rules (28 against 32 and 35), which is the one House measure on which it led them.
The plain poll average is a narrow test, because only 164 of 471 races had polls. On those races the plain average beat the published forecast on the Brier score in all three offices (0.1166 against 0.1304 pooled). Section 5.4 shows why: the model's adjustments to the polls moved them the wrong way.
5. Component-by-component decomposition
5.1 Method
Each ablation removes one component, or reverses one choice, and reruns the model's own code. The prior and the evidence stack are refitted on every cycle through 2024 without the component and applied to the 2026 rows with the final edition's admitted polls and the generic-ballot average the edition consumed. The unablated run reproduces the published centers: the median absolute difference is below 1e-14 in all three offices, and the only races that differ are the three independent-led Senate races, which carry a prior adjustment outside this pipeline and are not in the two-party panel.
Two things are held fixed. The governor G1 calibration and each race's published interval are not refitted per ablation, so the differences below come from the center alone. Probabilities use a normal distribution with the published interval; on the unablated model this reproduces the published Brier score to 0.0003 in the Senate and closer elsewhere.
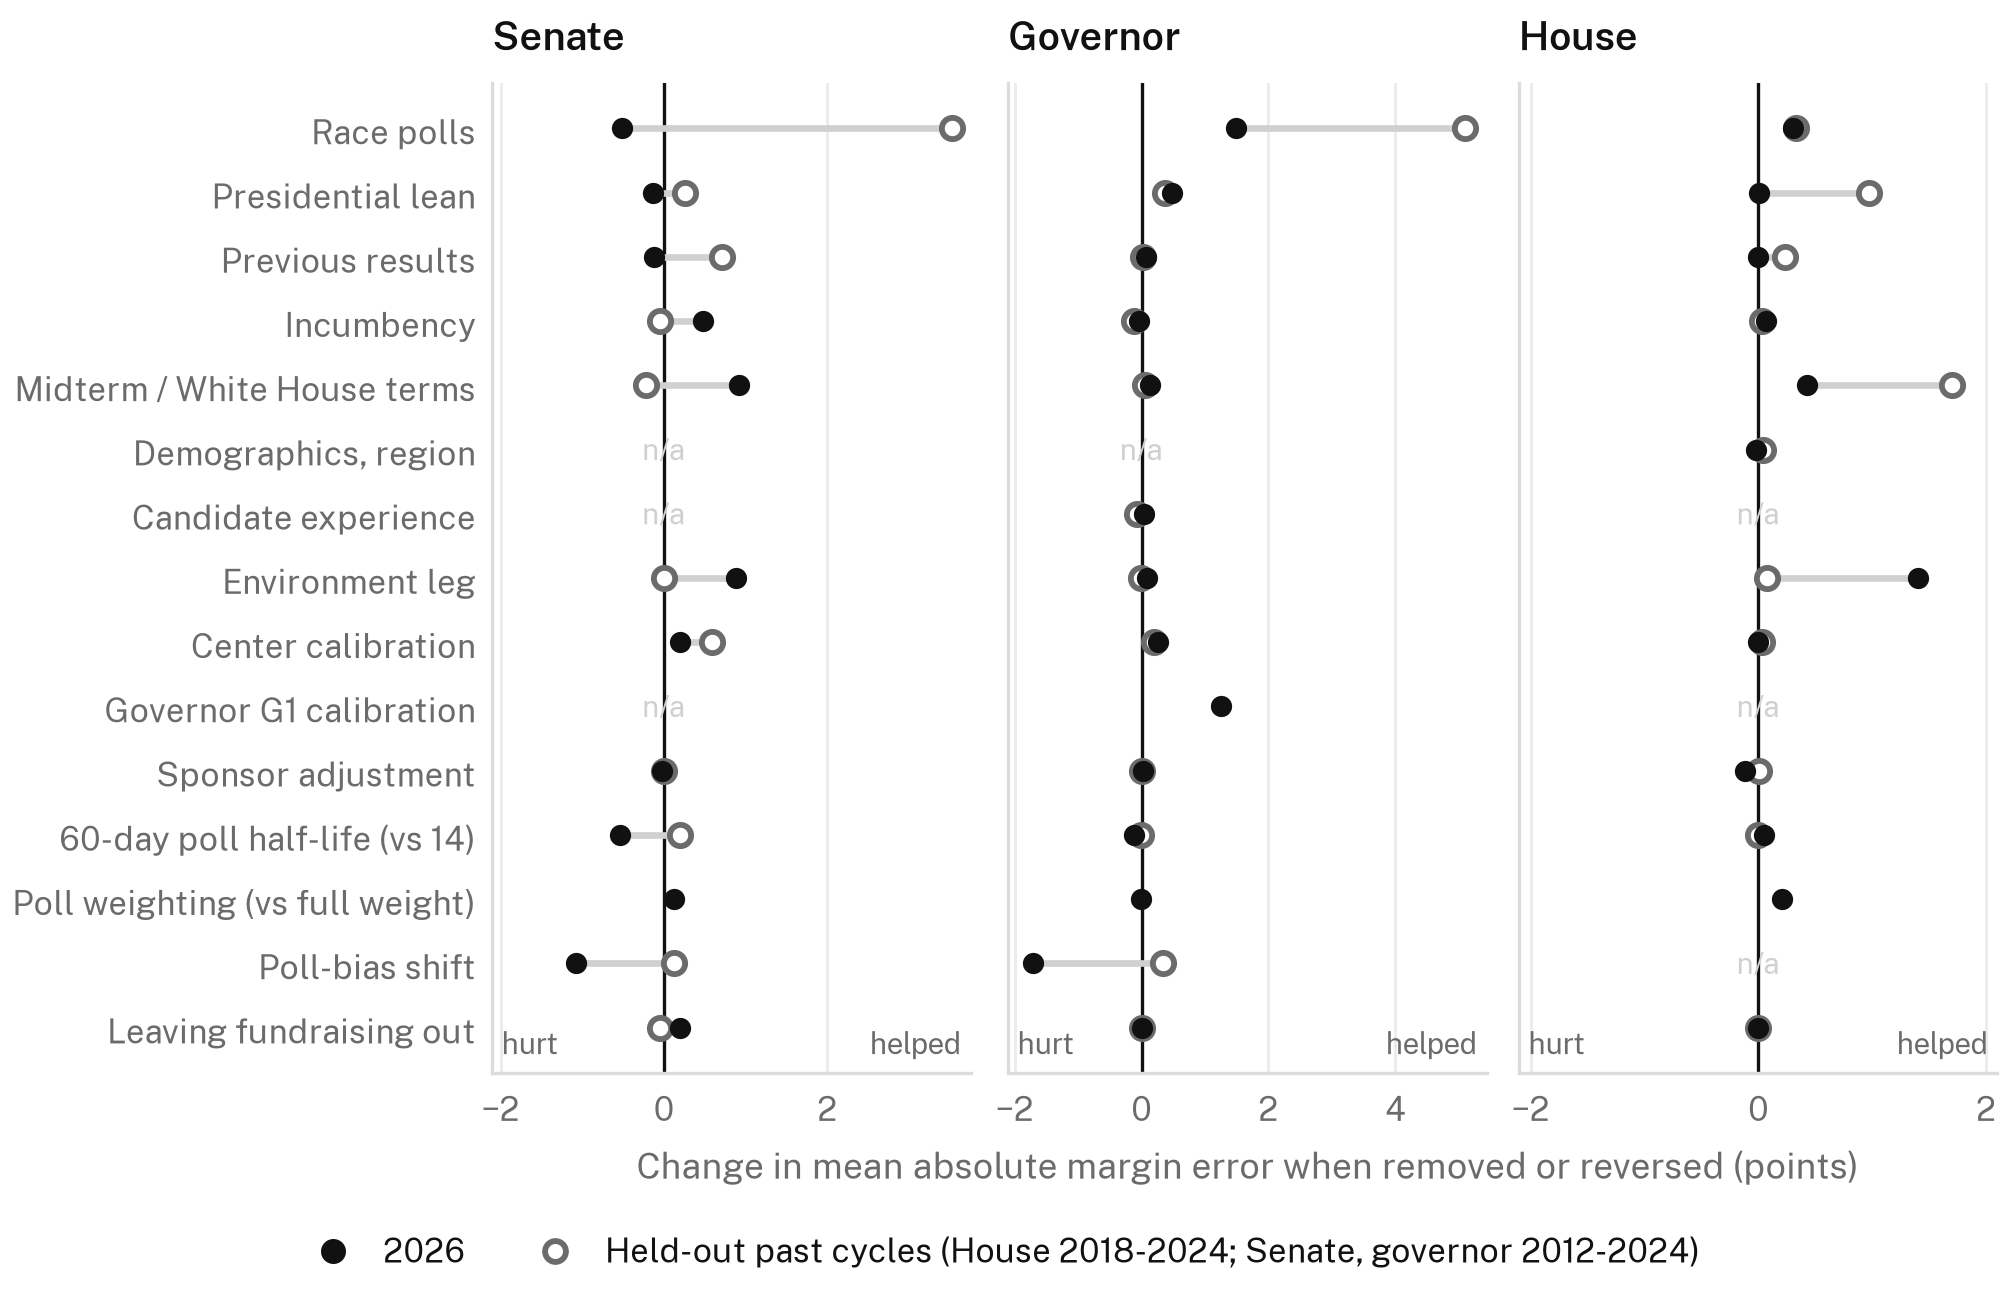
The same ablation is also run in the model's rolling-origin backtest: fitted on cycles before C, scored on cycle C at election eve, for the House in 2018 to 2024 and for the Senate and governors in 2012 to 2024. That column shows whether a component earned its place before 2026. It is not independent evidence in the strict sense, because the model's components were chosen with those cycles in view.
Margin and Brier changes are exact arithmetic on the same races and carry no simulation noise. The 90% intervals on Brier changes resample states. Chamber-control probabilities come from a one-factor simulation calibrated to the published seat spread and run under paired seeds, the same 20 seeds of 20,000 draws for the reference and for every ablation. The noise floor is the standard deviation of the paired difference across seeds, printed beside each number; it never exceeds 0.39 points.
In every table a positive change in MAE or Brier means the forecast got worse without the component, so the component helped. The 2026 verdict is mechanical: helped if removing it raises MAE by 0.10 points or more, or raises Brier by 0.0005 or more with an interval above zero; hurt in the mirror case; mixed if the two disagree; neutral otherwise.
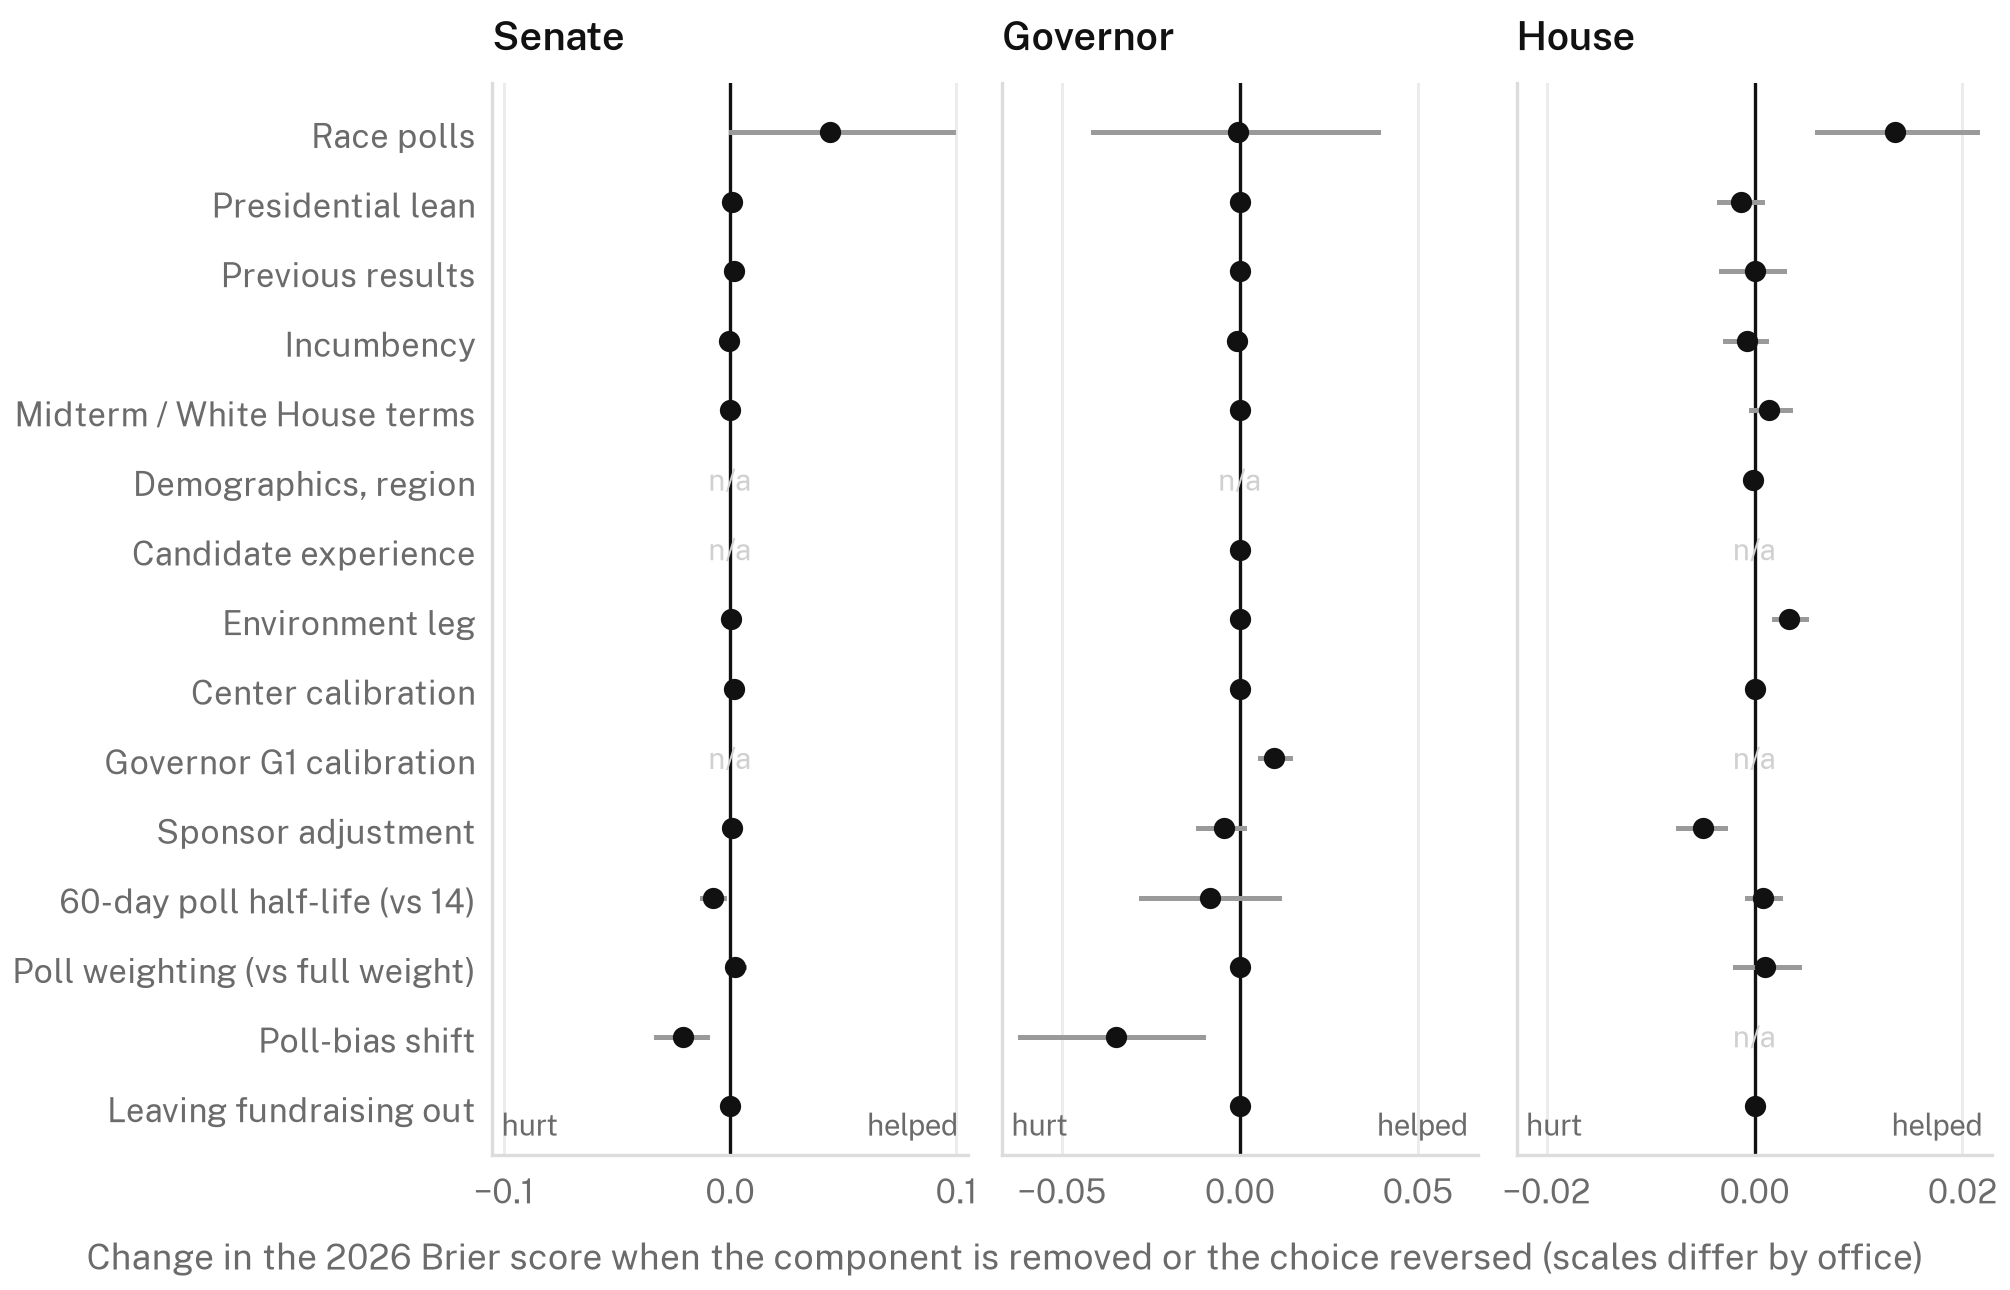
Table 12. Senate ablations. Changes are the ablated model minus the model as run.
| Component or choice | 2026 MAE change | 2026 mean-error change | 2026 Brier change [90% interval] | Expected D wins | P(D control), points (paired-seed SD) | Past MAE change | Past Brier change | Past cycles it lowered MAE | 2026 verdict |
|---|---|---|---|---|---|---|---|---|---|
| Race polls | −0.51 | +1.10 | +0.0442 [+0.0005, +0.0985] | −0.6 | −11.2 (±0.27) | +3.52 | +0.0251 | 7 of 7 | mixed |
| Presidential lean | −0.13 | −0.09 | +0.0009 [+0.0001, +0.0019] | +0.1 | +0.1 (±0.03) | +0.25 | +0.0021 | 6 of 7 | mixed |
| Previous results | −0.12 | +0.39 | +0.0015 [−0.0003, +0.0049] | +0.1 | +0.3 (±0.05) | +0.71 | +0.0008 | 5 of 7 | hurt |
| Incumbency and open seats | +0.47 | −0.78 | −0.0005 [−0.0010, +0.0000] | −0.0 | +0.3 (±0.05) | −0.05 | −0.0001 | 3 of 7 | helped |
| Midterm and White House terms | +0.91 | −0.96 | +0.0001 [−0.0006, +0.0012] | −0.1 | +0.1 (±0.02) | −0.22 | −0.0022 | 3 of 7 | helped |
| National-environment leg | +0.88 | −1.42 | +0.0004 [−0.0003, +0.0011] | −0.2 | −0.4 (±0.04) | +0.00 | +0.0001 | 2 of 7 | helped |
| Center calibration (Senate compression) | +0.20 | −0.56 | +0.0019 [+0.0004, +0.0033] | −0.0 | −1.1 (±0.07) | +0.59 | +0.0020 | 6 of 7 | helped |
| Poll weighting (against full weight) | +0.12 | −0.12 | +0.0021 [−0.0000, +0.0063] | +0.2 | +0.3 (±0.04) | not run | helped | ||
| 60-day poll half-life (against 14 days) | −0.54 | +0.59 | −0.0075 [−0.0126, −0.0029] | +0.3 | +4.2 (±0.12) | +0.19 | +0.0008 | 5 of 7 | hurt |
| Partisan-sponsor adjustment | −0.02 | +0.02 | +0.0010 [+0.0003, +0.0019] | −0.0 | −0.3 (±0.04) | +0.00 | +0.0000 | 1 of 7 | helped |
| Poll-bias shift | −1.08 | +1.20 | −0.0210 [−0.0327, −0.0103] | +1.0 | +10.9 (±0.17) | +0.13 | −0.0019 | 3 of 7 | hurt |
| Leaving fundraising out | +0.19 | −0.08 | −0.0001 [−0.0003, +0.0001] | −0.0 | −0.1 (±0.02) | −0.04 | −0.0001 | 4 of 7 | helped |
Table 13. Governor ablations.
| Component or choice | 2026 MAE change | 2026 mean-error change | 2026 Brier change [90% interval] | Expected D wins | Past MAE change | Past Brier change | Past cycles it lowered MAE | 2026 verdict |
|---|---|---|---|---|---|---|---|---|
| Race polls | +1.49 | +1.27 | −0.0006 [−0.0413, +0.0388] | +0.8 | +5.10 | +0.0718 | 7 of 7 | helped |
| Presidential lean | +0.48 | −0.48 | +0.0000 [+0.0000, +0.0001] | +0.0 | +0.36 | +0.0042 | 4 of 7 | helped |
| Previous results | +0.06 | −0.06 | −0.0000 [−0.0000, −0.0000] | −0.0 | +0.03 | +0.0009 | 4 of 7 | neutral |
| Incumbency and open seats | −0.04 | +0.04 | −0.0009 [−0.0026, −0.0000] | +0.0 | −0.12 | −0.0003 | 1 of 7 | hurt |
| Midterm and White House terms | +0.14 | −0.14 | −0.0000 [−0.0000, +0.0000] | −0.0 | +0.05 | −0.0002 | 4 of 7 | helped |
| Candidate experience | +0.04 | −0.04 | −0.0000 [−0.0000, +0.0000] | −0.0 | −0.08 | −0.0006 | 3 of 7 | neutral |
| National-environment leg | +0.08 | −0.08 | −0.0000 [−0.0000, +0.0000] | −0.0 | −0.00 | −0.0001 | 4 of 7 | neutral |
| Center calibration (Senate compression) | +0.27 | −0.27 | +0.0000 [+0.0000, +0.0000] | +0.0 | +0.20 | +0.0002 | 5 of 7 | helped |
| Governor G1 calibration | +1.25 | −1.17 | +0.0097 [+0.0058, +0.0140] | −0.5 | not run | helped | ||
| Poll weighting (against full weight) | −0.01 | +0.01 | +0.0000 [+0.0000, +0.0001] | +0.0 | not run | neutral | ||
| 60-day poll half-life (against 14 days) | −0.12 | +0.43 | −0.0085 [−0.0279, +0.0110] | +0.8 | −0.01 | +0.0021 | 4 of 7 | hurt |
| Partisan-sponsor adjustment | +0.02 | +0.10 | −0.0045 [−0.0119, +0.0010] | +0.2 | +0.01 | −0.0011 | 2 of 7 | neutral |
| Poll-bias shift | −1.70 | +2.52 | −0.0350 [−0.0618, −0.0104] | +2.2 | +0.35 | +0.0074 | 3 of 7 | hurt |
| Leaving fundraising out | +0.00 | +0.00 | +0.0000 [+0.0000, +0.0000] | +0.0 | +0.00 | +0.0000 | 0 of 7 | neutral |
Table 14. House ablations.
| Component or choice | 2026 MAE change | 2026 mean-error change | 2026 Brier change [90% interval] | Expected D wins | P(D control), points (paired-seed SD) | Past MAE change | Past Brier change | Past cycles it lowered MAE | 2026 verdict |
|---|---|---|---|---|---|---|---|---|---|
| Race polls | +0.30 | −0.26 | +0.0135 [+0.0060, +0.0214] | −4.8 | −2.6 (±0.15) | +0.33 | +0.0049 | 3 of 4 | helped |
| Presidential lean | +0.01 | +0.33 | −0.0013 [−0.0034, +0.0007] | +2.4 | +1.9 (±0.13) | +0.98 | +0.0034 | 4 of 4 | neutral |
| Previous results | −0.00 | +0.17 | +0.0000 [−0.0032, +0.0028] | +0.7 | +0.9 (±0.08) | +0.24 | +0.0003 | 3 of 4 | neutral |
| Incumbency and open seats | +0.06 | −0.14 | −0.0008 [−0.0029, +0.0011] | +1.1 | +0.1 (±0.10) | +0.03 | +0.0019 | 2 of 4 | neutral |
| Midterm and White House terms | +0.42 | −0.76 | +0.0014 [−0.0003, +0.0034] | −1.9 | −1.2 (±0.11) | +1.70 | +0.0045 | 3 of 4 | helped |
| Demographics and region | −0.02 | +0.02 | −0.0001 [−0.0007, +0.0005] | +0.1 | +0.1 (±0.06) | +0.04 | −0.0014 | 4 of 4 | neutral |
| National-environment leg | +1.40 | −1.79 | +0.0033 [+0.0018, +0.0050] | −3.2 | −3.9 (±0.13) | +0.07 | −0.0003 | 1 of 4 | helped |
| Center calibration (Senate compression) | +0.00 | +0.00 | +0.0000 [+0.0000, +0.0000] | +0.0 | +0.0 (±0.00) | +0.04 | −0.0000 | 1 of 4 | neutral |
| Poll weighting (against full weight) | +0.21 | +0.11 | +0.0010 [−0.0019, +0.0043] | +2.7 | +0.8 (±0.09) | not run | helped | ||
| 60-day poll half-life (against 14 days) | +0.05 | −0.07 | +0.0009 [−0.0007, +0.0024] | −1.0 | +0.6 (±0.09) | −0.00 | −0.0007 | 2 of 4 | neutral |
| Partisan-sponsor adjustment | −0.11 | +0.17 | −0.0050 [−0.0074, −0.0028] | +3.4 | +3.7 (±0.13) | +0.01 | +0.0001 | 2 of 4 | hurt |
| Leaving fundraising out | +0.00 | +0.00 | +0.0000 [+0.0000, +0.0000] | +0.0 | +0.0 (±0.00) | −0.01 | +0.0000 | 0 of 4 | neutral |
5.2 Fundamentals: partisan lean, previous results, incumbency
Presidential lean and previous results are the backbone of the prior in past cycles. Removing lean costs 0.98 points of House MAE over 2018 to 2024, and removing previous results costs 0.71 points in the Senate. In 2026 neither removal changed the aggregate score by a measurable amount in the House or Senate (House Brier change −0.0013 and +0.0000). The two carry overlapping information, so the model rebuilds most of one from the other when either is dropped. For governors, lean helped in both periods (+0.48 points of MAE in 2026).
Incumbency was close to neutral. Removing every incumbency and open-seat term changes the 2026 House Brier by −0.0008 and the governor Brier by −0.0009. It helped Senate margins by 0.47 points of MAE and lowered governor MAE in only 1 of 7 past cycles. Demographics and region in the House prior, and candidate experience in the governor prior, changed nothing measurable in 2026.
The midterm and White House terms helped in 2026. These are the constants that tell the prior a midterm under a Republican president favors Democrats. Without them the House forecast is 0.76 points more Republican, its MAE 0.42 points worse and its expected Democratic seats 1.9 lower. Senate MAE is 0.91 points worse without them. The first postmortem asked whether the prior had ignored the midterm penalty. It had not: the prior alone expected House Democrats to run 5.8 points ahead of the 2024 presidential margin in the average district. The actual figure was 14.9.
5.3 The national environment and the House elasticity
The model read one national signal, a 60-day average of generic-ballot polls. The edition consumed D+8.32. A fitted mapping turned that into an environment estimate of D+7.11, because in the six training cycles the generic ballot had more often overstated Democrats. The estimate then reached races through a fitted elasticity: 0.31 in the House, 0.52 in the Senate and 0.30 for governors. In the House the leg added 2.21 points to every district before polls.
The national House vote counted so far is D+14.0 in two-party terms across all seats and D+11.8 in seats both parties contested. The first postmortem's figure, from the November 7 count, was D+13.1. The model's own House forecasts, weighted by 2024 turnout, implied D+6.5, and the site's displayed environment was D+8.6. The model's board sat below its own displayed environment.
The leg helped. Without it the House forecast is 1.79 points more Republican, MAE rises by 1.40 points, the Brier score by 0.0033 (interval above zero), expected Democratic seats fall by 3.2 and the probability of a Democratic House by 3.9 points. Senate MAE rises by 0.88 points. In past cycles the leg was neutral (House MAE change +0.07).
It helped too little. Two counterfactuals in section 7 size that. With an elasticity of one and the same environment estimate, expected Democratic House seats rise by 11.1 and the pooled margin MAE falls from 7.32 to 5.59 points. With the generic ballot also taken at face value, seats rise by 14.9. This is the mechanism behind section 4's result that a uniform-swing rule matched the House model. It is also a hindsight result: the first postmortem showed that raising the elasticity on top of the current prior would have worsened the House forecast in each of 2018, 2020, 2022 and 2024, and the backtest in section 9 rejected the re-specification that was meant to fix it.
5.4 Polls: the average, its weight and three adjustments
Race polls were the most valuable component for probabilities. Removing them raises the 2026 Brier score by 0.0442 in the Senate and 0.0135 in the House, lowers the probability of a Democratic Senate by 11.2 points, and in past cycles costs 3.52 points of Senate MAE and 5.10 points of governor MAE. Their effect on 2026 margins was uneven. In the Senate, removing polls lowers MAE by 0.51 points: the poll input after the shift was more Republican than the prior plus environment (Table 15), so polls improved the ordering of Senate races and their probabilities while making the average margin worse. For governors the polls improved margins by 1.49 points of MAE and left the Brier score unchanged (−0.0006). The poll-bias shift discussed below is the likely reason: without the shift the governor Brier score falls to 0.0536.
The polls themselves missed. In the last 30 days, 565 admitted polls in the two-party panel were 4.6 points too Republican on average, and the average of recent polls was too Republican in 90 of 119 polled races. Republican-sponsored polls missed by 6.9 points (58 polls), polls without a partisan sponsor by 4.7 (416) and Democratic-sponsored polls by 2.3 (91). Older polls were further off: 6.7 points for polls more than 60 days old against 4.4 for the final week.
Table 15. The poll input at each stage, polled races of the two-party panel. Each cell is mean error / MAE in points; negative means too Republican.
| Office | Polled races | Plain poll average | After recency, size and sponsor rules | After the poll-bias shift | Prior plus environment | Published center | Published closer than the plain average | Published closer than prior plus environment |
|---|---|---|---|---|---|---|---|---|
| Senate | 24 | −5.55 / 6.08 | −5.64 / 6.03 | −7.20 / 7.36 | −5.44 / 6.17 | −6.50 / 6.50 | 9 of 24 | 11 of 24 |
| Governor | 30 | −4.03 / 5.70 | −4.12 / 5.61 | −6.64 / 7.46 | −5.27 / 7.26 | −5.49 / 6.11 | 10 of 30 | 18 of 30 |
| House | 110 | −4.76 / 7.13 | −5.64 / 7.56 | −5.64 / 7.56 | −7.04 / 7.92 | −6.07 / 6.78 | 48 of 110 | 73 of 110 |
| All three | 164 | −4.74 / 6.72 | −5.36 / 6.98 | −6.05 / 7.52 | −6.49 / 7.54 | −6.02 / 6.62 | 67 of 164 | 102 of 164 |
Table 15 follows the poll input through the model. The plain average was 4.74 points too Republican. The recency, sample-size and sponsor rules moved it to 5.36. The poll-bias shift moved the Senate and governor inputs to 7.20 and 6.64. The published center was closer to the result than the plain poll average in 67 of 164 polled races, fewer than half. It was closer than the prior plus environment in 102.
The poll-bias shift was the costliest single choice in the statewide races. It is a fitted correction, the shrunken average of past election-eve poll errors, added to every Senate and governor poll average: 1.57 points toward Republicans in the Senate and 2.53 for governors. Refitting without it lowers Senate MAE by 1.08 points and the Senate Brier score by 0.0210 (from 0.0587 to 0.0377), adds 1.0 expected Democratic seat and raises the probability of a Democratic Senate by 10.9 points, to 74%. For governors it lowers MAE by 1.70 points and the Brier score from 0.0886 to 0.0536, and adds 2.2 expected Democratic governorships. In past cycles its record was modest. Removing it costs 0.13 points of Senate MAE and 0.35 of governor MAE on average, and it lowered MAE in 3 of 7 Senate cycles and 3 of 7 governor cycles.
The partisan-sponsor adjustment hurt the House. The rule subtracts 2 points from a Democratic-sponsored poll and adds 2 to a Republican-sponsored one. In the final month 56 of 113 admitted House polls were Democratic-sponsored and 4 were Republican-sponsored, so the rule moved House averages toward Republicans on net. The Democratic-sponsored polls were already 3.1 points too Republican before the rule moved them further. Refitting without the rule lowers the House Brier score by 0.0050 (interval below zero), adds 3.4 expected Democratic seats and raises the probability of a Democratic House by 3.7 points. In past cycles the rule made no measurable difference (House MAE change +0.01).
The 60-day poll half-life hurt the Senate. Opinion moved toward Democrats through October, and a long half-life kept older polls in the average. With a 14-day half-life the Senate MAE is 0.54 points lower, the Brier score 0.0075 lower and the probability of a Democratic Senate 4.2 points higher. The House is unchanged. In past cycles the 60-day setting was the better one for the Senate, in 5 of 7 cycles.
Poll weighting was neutral to slightly helpful. Giving polls full weight wherever a race has any raises House MAE by 0.21 points and Senate MAE by 0.12. The model estimates no pollster house effects: the aggregator weights polls by recency, sample size and sponsor and ignores pollster identity beyond counting one poll per pollster. There is nothing to ablate, and the first postmortem found that named pollsters' errors ranged from under 1 point to more than 8.
5.5 Calibration layers
Both calibration layers helped. The governor G1 calibration, a fitted linear stretch of the center, lowered governor MAE by 1.25 points and the Brier score by 0.0097 (interval above zero). The Senate center calibration and compression lowered Senate MAE by 0.20 points and the Brier score by 0.0019 (interval above zero), and it lowered MAE in 6 of 7 past cycles. The House has no center calibration, so its row is zero by construction.
5.6 Fundraising
Fundraising was off in the production model in all three offices, so it contributed nothing to the 2026 forecast. Switching it on for the Senate, the one office with 2026 finance data wired into the model, would have raised Senate MAE by 0.19 points and left the Brier score unchanged (−0.0001). In past cycles its effect is within 0.04 points of MAE in every office. Leaving it out was the right call or an immaterial one.
5.7 Prediction markets
Prediction markets were display-only in CTMM 2.2, with weight zero in every race. Whether a forecast should take market prices as an input is a policy question about independence, and Call the Map settled it for 2026 by leaving them out. This report does not rank markets beside the forecasts, because a market price is a price, not a forecast.
5.8 Independent, third-candidate and ranked-choice races
Table 17. Probability scores by race type, all-office sources, leaders hold.
| Race type | Races | Our Brier | Mean of other models | Our rank among the seven all-office sources | Our wrong calls | Field-mean wrong calls |
|---|---|---|---|---|---|---|
| Independent-led or third principal candidate | 8 | 0.1031 | 0.1116 | 2 of 7 | 1 | 1 |
| Ranked-choice rules (Alaska, Maine federal) | 6 | 0.1218 | 0.0801 | 6 of 7 | 0 | 0 |
| Top-two primary states (California, Washington) | 53 | 0.0038 | 0.0016 | 6 of 7 | 0 | 0 |
| Majority or runoff rules (Georgia, Louisiana, Mississippi) | 26 | 0.0436 | 0.0372 | 7 of 7 | 2 | 1 |
| Ordinary two-party plurality | 394 | 0.0619 | 0.0497 | 7 of 7 | 34 | 27 |
The special-race rules adopted on October 5 held up where an independent or a third principal candidate was in the race. In those 8 races our Brier score was 0.1031, 2nd of 7 sources and better than the other models' mean (0.1116). Eight races cannot carry much weight, and the first postmortem found that the independents' own polls overstated them in three of four Senate races. In the 6 ranked-choice races we ranked 6th of 7, and three of those are Alaska races that are not yet called.
5.9 Correlation structure and uncertainty
The joint simulation is the component that did the most for the headline claims the forecast made, and section 6.1 gives the evidence. In brief: the draws gave the average error across races a standard deviation of 3.9 points in the House and 4.4 in the Senate. The realized shared errors were 6.3 and 5.5 points, 1.6 and 1.2 standard deviations. The total size of the shared shock was about right.
Its split was wrong. A common factor carries 25% of a House race's variance in the draws and 28% of a Senate race's. In the realized errors the shared mean is 53% and 51% of the mean squared error. Race-level intervals were therefore too narrow against a shared miss and too wide once it is removed: with the mean error taken out, the Senate and governor 80% intervals cover 97% and 94% of results.
5.10 Turnout and early vote
The model has no turnout or early-vote term. The early-vote counts the site published were never a forecast input, as the operations runbook states. There is nothing to ablate.
5.11 The expert-free decision
Expert ratings were removed from every office on September 9 as a policy of independence. The paired comparison recorded that day, on the same inputs with all downstream layers refitted, moved expected Democratic House seats from 226.3 to 229.4, left the Senate unchanged (50.02 to 50.03 seats) and moved expected Democratic governorships from 18.90 to 18.99. The House moved 3 seats toward the eventual result. On historical validation the removal was a trade: House MAE 5.68 to 5.64, House Brier .0396 to .0414 (docs/model/ctmm22-candidates-2026-09-08/EXPERT_FREE.md).
Its effect on the final forecast cannot be measured. No ratings were collected after September 8, so there is no November rating to add back. One captured comparison bears on it: VoteHub published a model with expert ratings and Kalshi prices (Complete) beside one without (Legacy). Complete scored 0.0432 and Legacy 0.0445, a difference of 0.0013. That is another forecaster's model and bundles two inputs, so it shows the order of magnitude and no more.
5.12 Summary of the decomposition
Six components helped in 2026: race polls (on probabilities in the Senate and House, and on margins for governors), the national-environment leg, the midterm and White House terms, the governor G1 calibration, the Senate center calibration and the joint simulation's shared error.
Four hurt: the poll-bias shift in the Senate and governor races, the partisan-sponsor adjustment in the House, the 60-day poll half-life in the Senate and the low House elasticity.
The rest were neutral: incumbency, demographics and region, candidate experience, poll weighting, and previous results and presidential lean in the House, where each is rebuilt from the other when removed. Fundraising was off. Pollster house effects, turnout, early vote, prediction markets and expert ratings were not in the model.
Every component that hurt in 2026 moved the forecast toward Republicans, and each had a neutral or mildly positive record in earlier cycles. None was a mistake that the pre-2026 evidence would have caught.
6. What performed well
Each claim in this section has a number, a comparison and a denominator. Section 6.9 lists the candidate strengths that were tested and did not hold.
6.1 The seat distributions and the shared error
The forecast's statements about chambers were statements about a distribution, and the distributions held. Democrats hold or lead 260 House seats against a published mean of 235.5 and a standard deviation of 18.8. The result is 1.30 standard deviations above the mean, at the edge of the 80% interval (212 to 260) and well inside the 95% interval (203 to 276). The forecast gave 10.5% to a Democratic count this high or higher. The Senate result of 56 is 1.19 standard deviations above the mean of 51.6, and the 24 governorships are 1.21 above 19.6. Three results near the 88th to 90th percentile of three distributions is what one shared error of moderate size looks like.
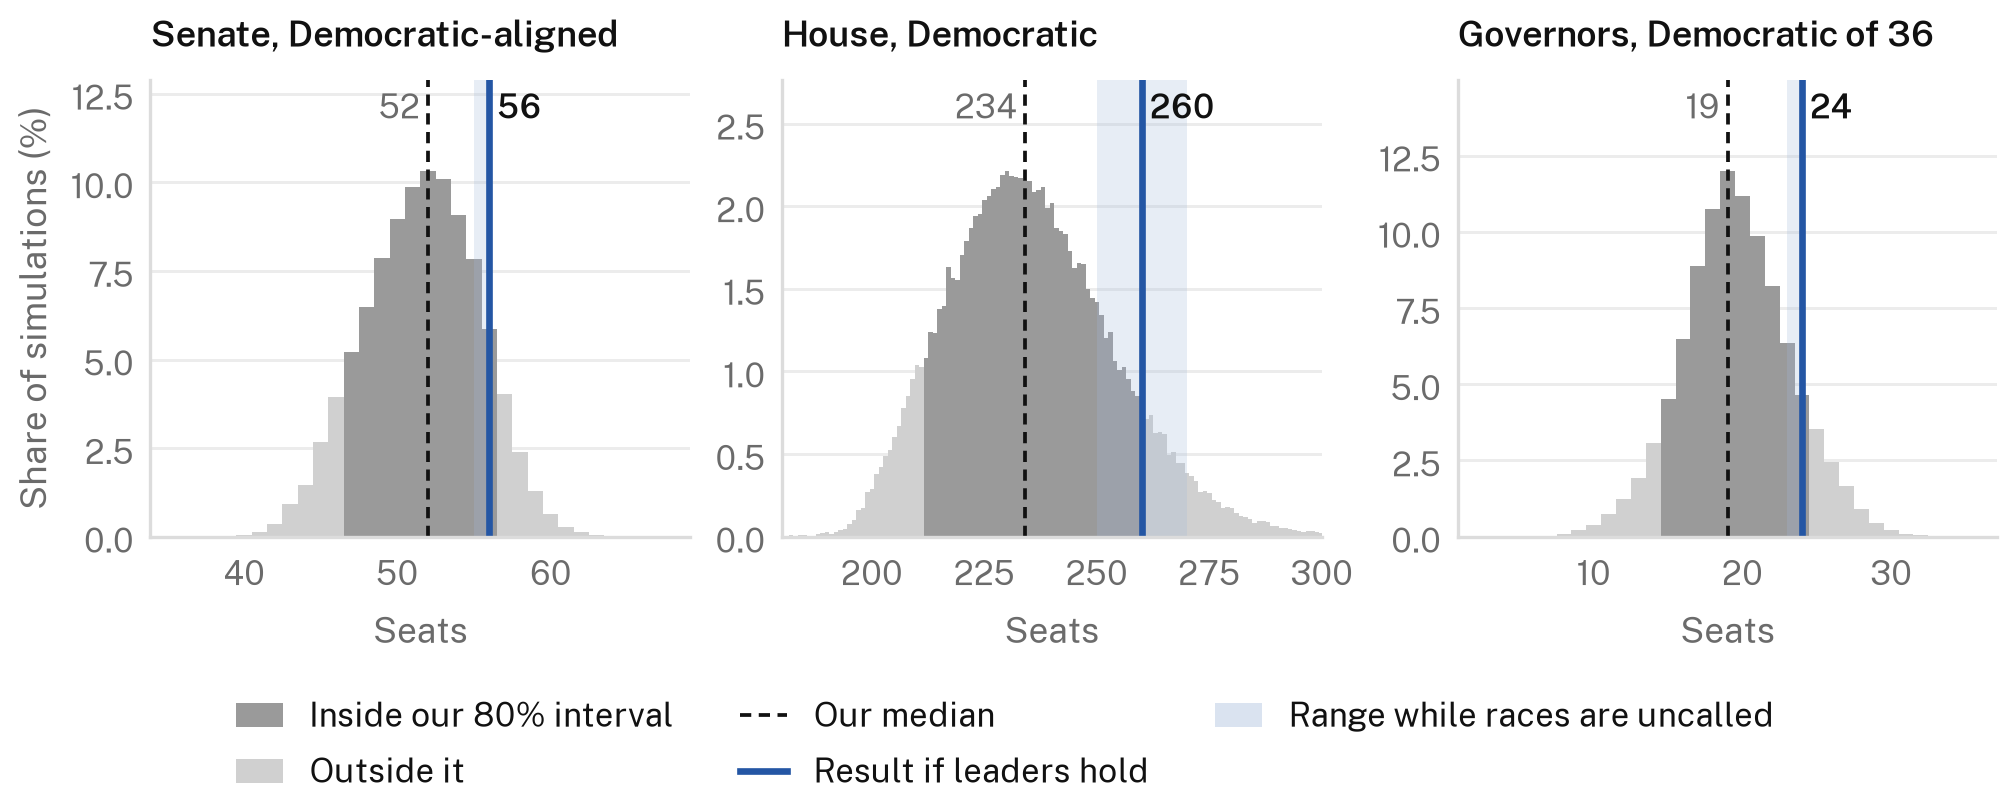
The comparison that shows this was earned is the same forecast without its correlation structure. If each race had been drawn independently from its published probability, the House distribution would have had a standard deviation of 4.2 seats and an 80% interval of 231 to 241. The actual 260 would have been 5.7 standard deviations out, an event that distribution gives a probability below one in ten million. The Senate result would have been 2.5 standard deviations out with a probability of 1.3%, against the published 14.8%. The joint simulation multiplied the House seat variance by 20.
The size of the shared shock was also right against history. The model's election-eve mean error on held-out cycles from 2018 to 2024 has a root mean square of 3.2 points in the House and 3.9 in the Senate. The draws carried 3.9 and 4.4. The 2026 miss of 6.3 and 5.5 points had a one-sided probability of 5% and 10% under the model's own draws. A forecast that says a five- or six-point shared miss toward one party happens about one time in ten or twenty, and then meets one, has described its uncertainty correctly at the chamber level.
Table 18. Election-eve mean error of the same model on held-out cycles and in 2026 (two-party points; negative means too Republican).
| Office | 2018 | 2020 | 2022 | 2024 | 2026 | RMS, 2018 to 2024 | RMS with 2026 |
|---|---|---|---|---|---|---|---|
| House | +0.43 | +4.50 | −4.64 | −0.14 | −6.61 | 3.24 | 4.14 |
| Senate | +3.89 | +6.33 | −1.15 | +1.77 | −5.46 | 3.86 | 4.23 |
| Governor | −3.90 | +6.45 | −0.42 | +3.33 | −5.53 | 4.13 | 4.44 |
This strength has a limit that section 3.4 already showed. A wide distribution centered too low still gave Democratic control of the Senate 62%, the lowest figure of any source.
6.2 The Senate model against baselines, and governor margins
Section 4 gave the numbers. In the 29 two-way Senate races the model's Brier score was 0.0584 against 0.0916 for the best simple rule, a difference whose 90% interval excludes zero, with 2 wrong calls against 5. For governors the model's margin MAE was 6.14 points against 8.08 for the best rule, and its rank correlation 0.956 against 0.891. In both statewide offices the model knew much more about the order of races than lean and history do. Polls supplied that knowledge: section 5.4 showed that removing them raises the Senate Brier score by 0.0442.
6.3 Margins in Republican-held seats
In the 247 Republican-held seats of the two-party panel our margin MAE was 6.74 points and our mean error −6.0. The mean of the other model forecasters, which as an average of several models is a hard benchmark, had an MAE of 6.92 and a mean error of −6.5. The same holds for seats with a Republican incumbent running (6.81 against 7.01, 185 races) and, by a wider gap, for seats that voted Republican for president by 20 points or more (6.86 against 7.63, 142 races).
Two cautions belong beside this. These are mostly safe seats, so better margins there did not improve the probability score: our Brier in Republican-held seats was 0.0855 against the field mean's 0.0706. And the mirror image is one of the largest failures in section 8: in Democratic-held seats our MAE was 7.64 against 4.83. Our forecast erred by a similar amount in both kinds of seat. The field's error was less than half as large in Democratic-held seats and slightly larger than ours in Republican-held seats.
6.4 Independent and third-candidate races
In the 8 races with an independent in a major party's place or a third principal candidate, our Brier score was 0.1031, 2nd of the 7 all-office sources (Table 17). Only On Point Politics was better. These races were the reason the model freeze was lifted on October 5, and the rules adopted then did not cost accuracy. With 8 races the result is consistent with luck.
6.5 The error was mostly one shared miss
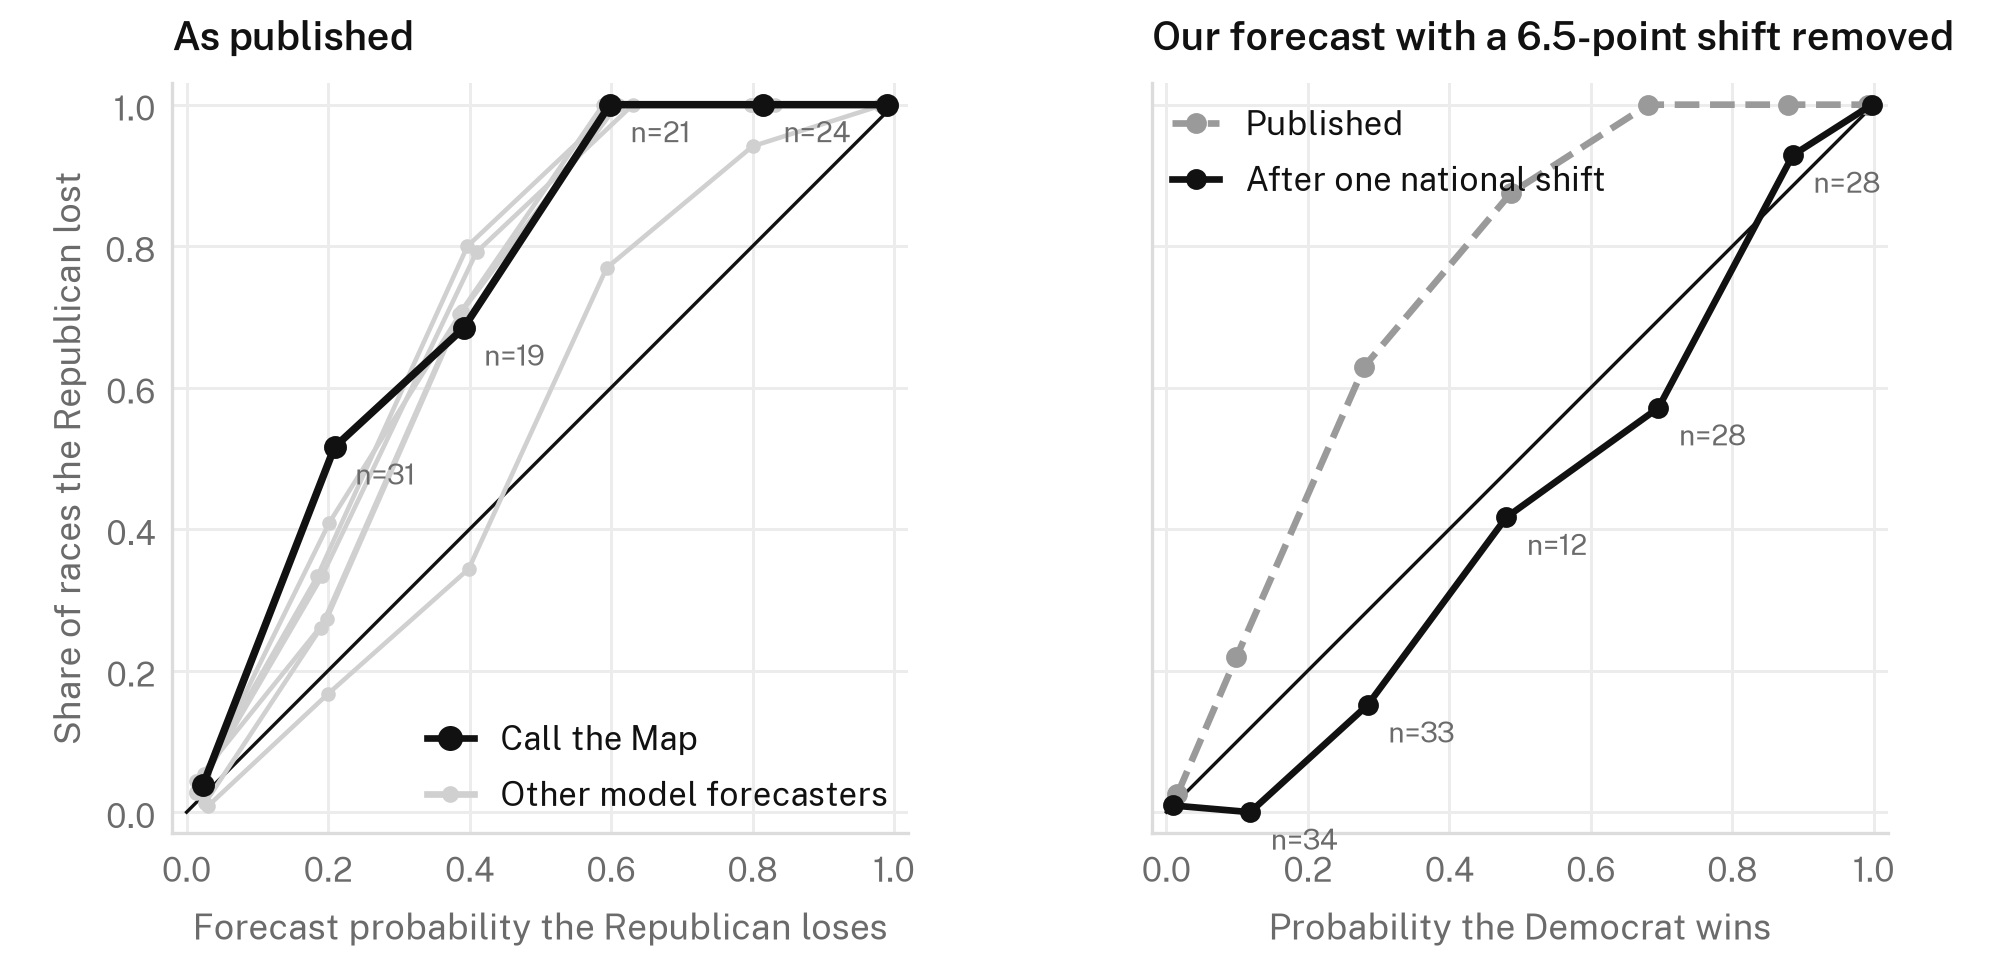
Moving every one of our centers by the realized mean error of 6.5 points, and nothing else, lowers the Brier score on the two-party panel from 0.0538 to 0.0375, the wrong calls from 35 to 22 and the margin MAE to 4.90 points. A separate shift for each office does no better (0.0378), because the three offices missed by nearly the same amount. With the shift removed, the 80% intervals cover 83% of results and the 95% intervals 97%.
This is a statement about the structure of the error. It is a strength only in a limited sense: what remained after the shared miss was sound and unremarkable. Figure 2 made the comparison with other sources, where the same correction leaves us 5th of 7.
6.6 Certainty where it was claimed
Of the 205 races where we gave the favorite 99% or more, none was lost. Of the 360 at 95% or more, four were lost or are trailing, 1.1% against a mean stated risk of 1.1%. Two of those four are uncalled races with margins under 0.2 points. Among the other sources the count of such races lost ranged from 1 to 5. Our safe calls were reliable in absolute terms and average for the field.
6.7 A steady forecast that moved the right way
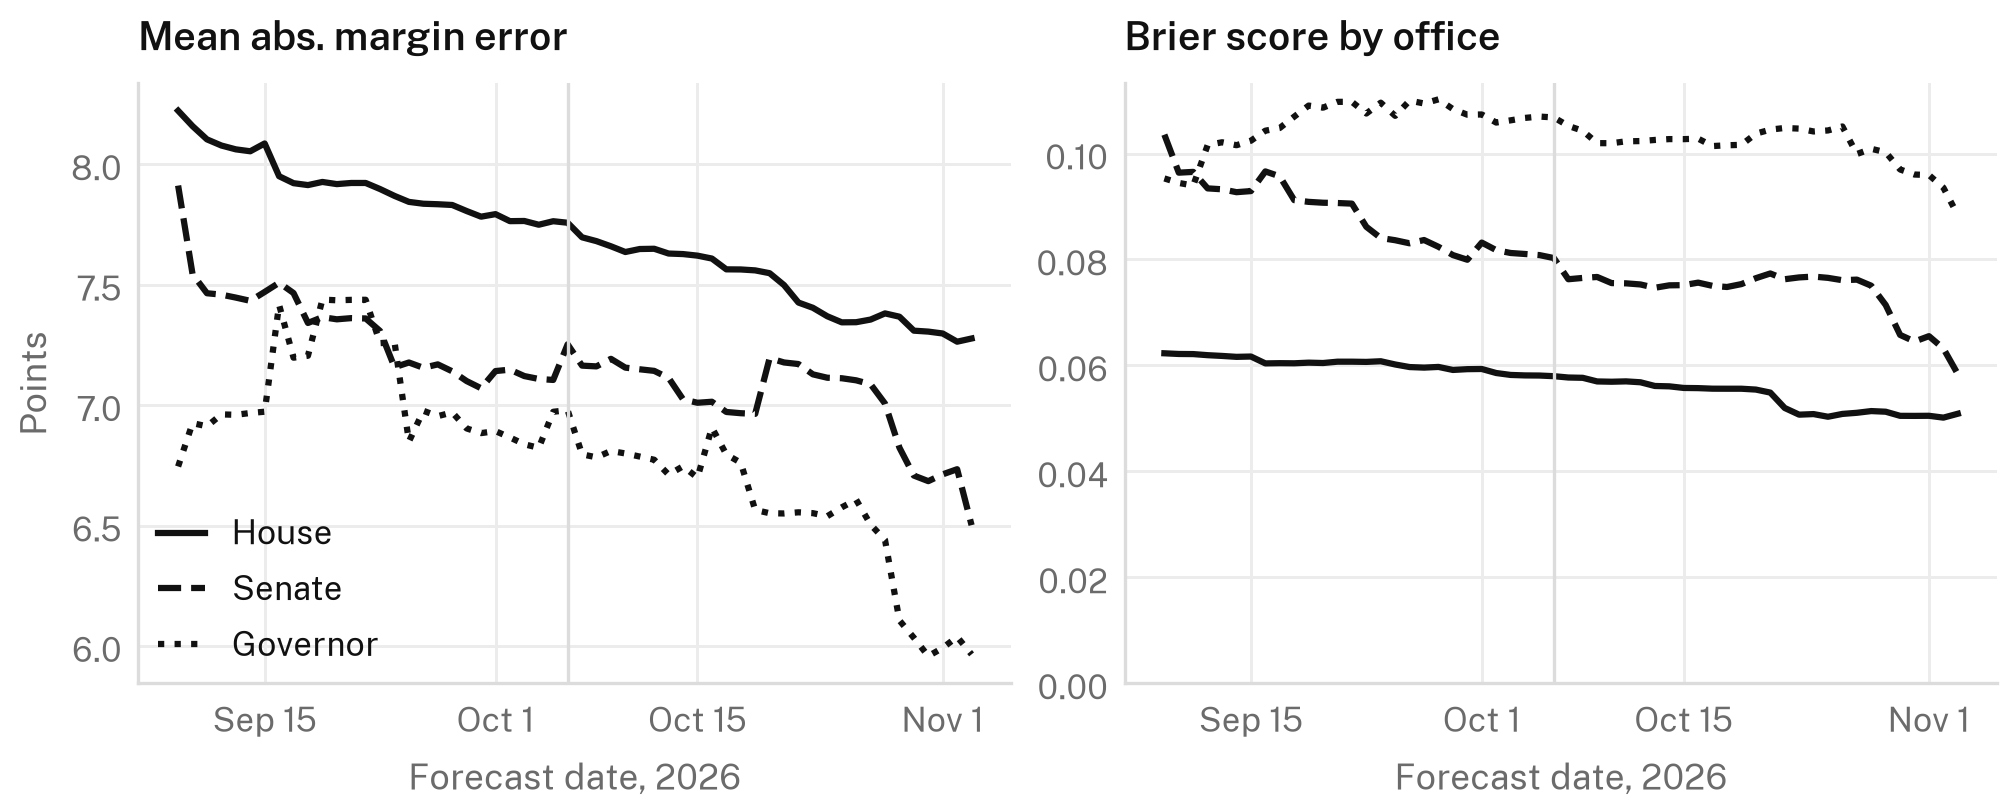
The forecast improved through the campaign. Between September 9 and November 3 the pooled Brier score fell from 0.0670 to 0.0538 and the margin MAE from 8.11 to 7.14 points. The House MAE fell on 42 of 55 days. The final edition had the lowest margin MAE of the 56 days and a pooled Brier score within 0.0001 of the best day, November 2. The freeze at noon on November 3 cost nothing measurable. The favorite changed between the first and last reading in 13 of 471 races, and in 11 of those 13 the final favorite won.
Our win probabilities moved steadily toward the result, without large reversals. No time series was captured for the other model forecasters, so this report cannot say whether they moved faster or slower.
6.8 What the first reading already had
The September 9 reading ordered races almost as well as the final one. Its rank correlation with actual margins was 0.9727 against 0.9757 on November 3, and its favorite won in 427 of 471 races against 436 at the end. It favored Democrats to win the House on every one of the 56 days, never below 74%. Democratic control of the Senate was below even odds at the start (43%) and crossed 50% on September 25. Eight weeks is the whole record of this model, and days before October 6 are restated with the current method, so nothing can be said about what the forecast showed months out.
6.9 Candidate strengths that the data does not support
Table 19. Candidate strengths that were tested and did not hold.
| Claim tested | What the data shows | Denominator |
|---|---|---|
| Better race ordering than the field | Rank correlation of margins 0.9761, 6th of 7; AUC 0.9905, 5th of 7 | 477 and 485 races |
| Better race ordering than a baseline in the House | Rank correlation 0.9760 for the model, 0.9731 for the unchanged 2024 presidential margin | 411 races |
| Right when we disagreed with the consensus | Our favorite differed from the other models' mean favorite in 10 races; we were right in 1 (Table 20) | 486 races |
| An office or region where we led on probability | Last on the Brier score in all three offices; behind the other models' mean in all four Census regions | 485 races |
| Accuracy in the most-polled races | Brier 0.1245 against the field mean's 0.0768 | 30 races with 15 or more polls |
| Better in races Republicans won | 5th of 9 | 197 races |
| Ranked-choice races | 6th of 7 | 6 races |
| A better state-level pattern | Our state mean error was closer to zero than the field's in 7 states | 42 states with three or more races |
| Well-sized race intervals | Our 80% intervals covered 61%; On Point Politics' published 80% intervals, 29% wider than ours, covered 89% | 471 and 478 races |
| Steadiness as skill | Steady movement is not skill on its own, and no time series of the other models was captured to compare it with (section 6.7) | 56 days |
| A forecast that held up from months out | The record of this model is eight weeks | 56 days |
Table 20. Every race in which our favorite differed from the favorite of the other models' mean probability.
| Race | Our P(D) | Other models' mean P(D) | Winner | Margin | Who had the favorite right |
|---|---|---|---|---|---|
| SEN-IA | 44% | 52% | D | D+4.2 | the field was |
| GOV-GA | 38% | 61% | D | D+8.7 | the field was |
| GOV-NV | 30% | 59% | D | D+7.6 | the field was |
| GOV-OR | 41% | 80% | D | D+9.6 | the field was |
| FL-22 | 46% | 55% | D | D+3.8 | the field was |
| IA-03 | 45% | 74% | D | D+7.3 | the field was |
| KY-06 | 57% | 47% | D | D+9.4 | we were |
| MI-10 | 23% | 61% | D | D+7.2 | the field was |
| PA-01 | 34% | 58% | D | D+5.7 | the field was |
| TX-35 | 49% | 60% | D | D+10.9 | the field was |
7. What failed, in order of cost
Table 21 puts the failures on one scale. Each row changes the published centers in one stated way and rescores the 471-race two-party panel. The rows overlap and do not add up: removing the national shift removes most of what every other row removes. The first two rows are measurements of the miss. The others are counterfactuals for a named mechanism.
Table 21. Cost of each failure: change from the published forecast when it is removed. Negative Brier, wrong-call and MAE changes are improvements. The published forecast scores 0.0538 with 35 wrong calls and an MAE of 7.32 points on this panel.
| Counterfactual: what is removed or reversed | Brier | Wrong calls | MAE (points) | Expected D House seats | Expected D Senate seats | Expected D governorships |
|---|---|---|---|---|---|---|
| The whole shared miss (hindsight: every center moved by the realized mean error) | −0.0163 | −13 | −2.41 | +34.5 | +3.6 | +4.9 |
| Our extra Republican lean relative to the other forecasters' mean, by office | −0.0086 | −5 | −0.90 | +7.2 | +0.2 | +1.3 |
| The extra error on redrawn House districts | −0.0049 | −3 | −0.61 | +5.6 | +0.0 | +0.0 |
| The partisan-sponsor adjustment | −0.0046 | −2 | −0.10 | +3.4 | −0.0 | +0.2 |
| House elasticity 0.31 and the generic-ballot mapping (against elasticity 1, generic ballot at face value) | −0.0046 | −3 | −1.89 | +14.9 | +0.0 | +0.0 |
| House elasticity 0.31 alone (against elasticity 1, same environment estimate) | −0.0045 | −2 | −1.72 | +11.1 | +0.0 | +0.0 |
| The poll-bias shift (Senate, governor) | −0.0036 | −3 | −0.18 | +0.0 | +1.0 | +2.2 |
| The 60-day poll half-life (against 14 days) | −0.0003 | +5 | −0.00 | −1.0 | +0.3 | +0.8 |
7.1 The shared miss
Democrats beat our forecast in 85% of races, by 6.5 points on average. That one number is worth 0.0163 of our 0.0538 Brier, 13 of our 35 wrong calls on the panel, and 34 expected House seats.
Most of it was shared with everyone. The other models' mean margin error was −5.1 in the House, −5.0 in the Senate and −3.7 for governors, against our −6.5, −5.4 and −5.5. The inputs explain why no model escaped. The generic ballot said D+8.3 and the House vote is D+14.0. Race polls in the final month were 4.6 points too Republican. A forecast built on those inputs could be right about 2026 only through its uncertainty.
7.2 Our extra Republican lean
Our forecast was more Republican than the other models' mean by 1.5 points in the House, 0.4 in the Senate and 1.7 for governors. Closing that gap, and changing nothing else, would have lowered our Brier score by 0.0086 and removed 5 wrong calls. The whole gap between our Brier score and the other models' mean on this panel is 0.0111. Most of the distance between us and the middle of the field is therefore level, and the mechanisms below are where the level came from.
7.3 The House elasticity and the generic-ballot mapping
In seats this was the largest single mechanism. The mapping lowered the generic ballot from D+8.32 to D+7.11, and the elasticity of 0.31 passed less than a third of the environment's distance from its reference into unpolled districts. With an elasticity of one and the generic ballot at face value, expected Democratic House seats would have been 251 in place of 236, and the House Brier score 0.0456 in place of 0.0509. That counterfactual is nearly the uniform-swing baseline of section 4, which is why the baseline matched the model. As section 5.3 said, the same change would have hurt in each of the four previous cycles.
7.4 Redrawn districts
The 158 House districts redrawn since 2024 missed by 8.27 points on average against 5.57 for the 253 with unchanged lines, a difference of 2.70 points with a state-clustered standard error of 1.28. Removing the extra error is worth 0.0049 Brier and 5.6 expected seats. This failure was shared: the other models' mean error was 6.53 points on redrawn districts and 4.13 on the rest, a difference of 2.40. New lines were harder for every forecaster.
7.5 Three poll adjustments
The partisan-sponsor adjustment cost 0.0046 Brier on the pooled panel and 3.4 expected House seats. The poll-bias shift cost 0.0036 pooled, concentrated in 60 statewide races where it raised the Brier score by more than half, and it cost 1.0 expected Senate seat and 2.2 governorships. The 60-day half-life cost the Senate 0.0075 Brier and nothing in aggregate. Section 5.4 gave the mechanisms. All three were fitted or chosen on past cycles in which polls more often overstated Democrats.
7.6 Wrong calls and thinly polled House races
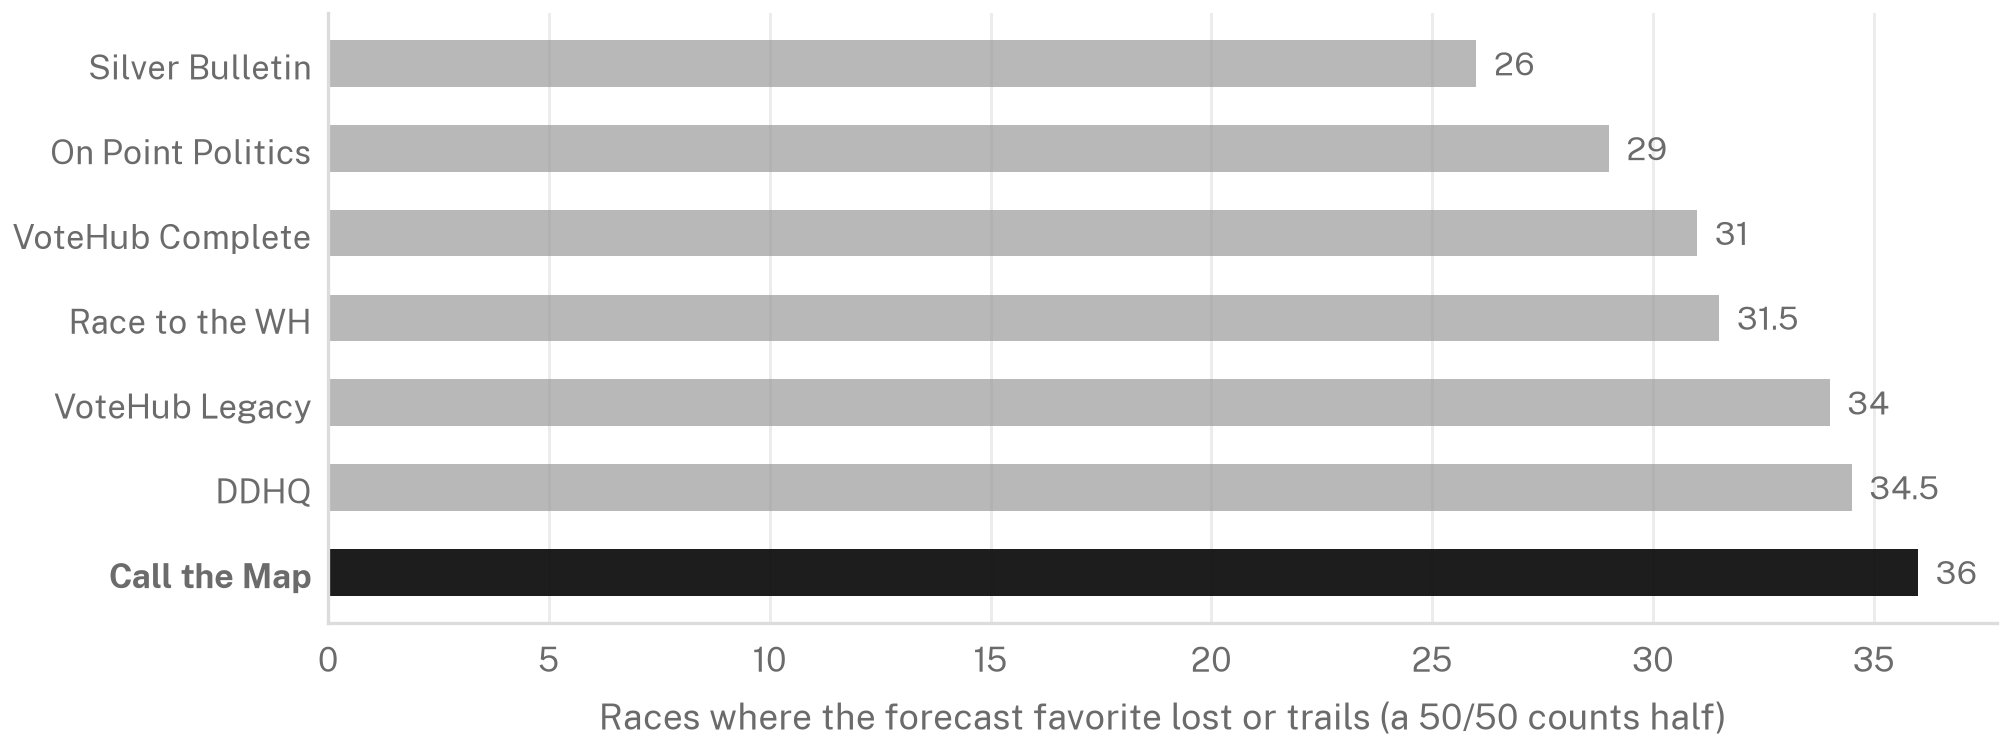
Of our 36 wrong calls, 27 were also wrong for the other models' mean and 16 were missed by every model that forecast the race. Three were ours alone among the models (GOV-OR, IA-03, TX-35).
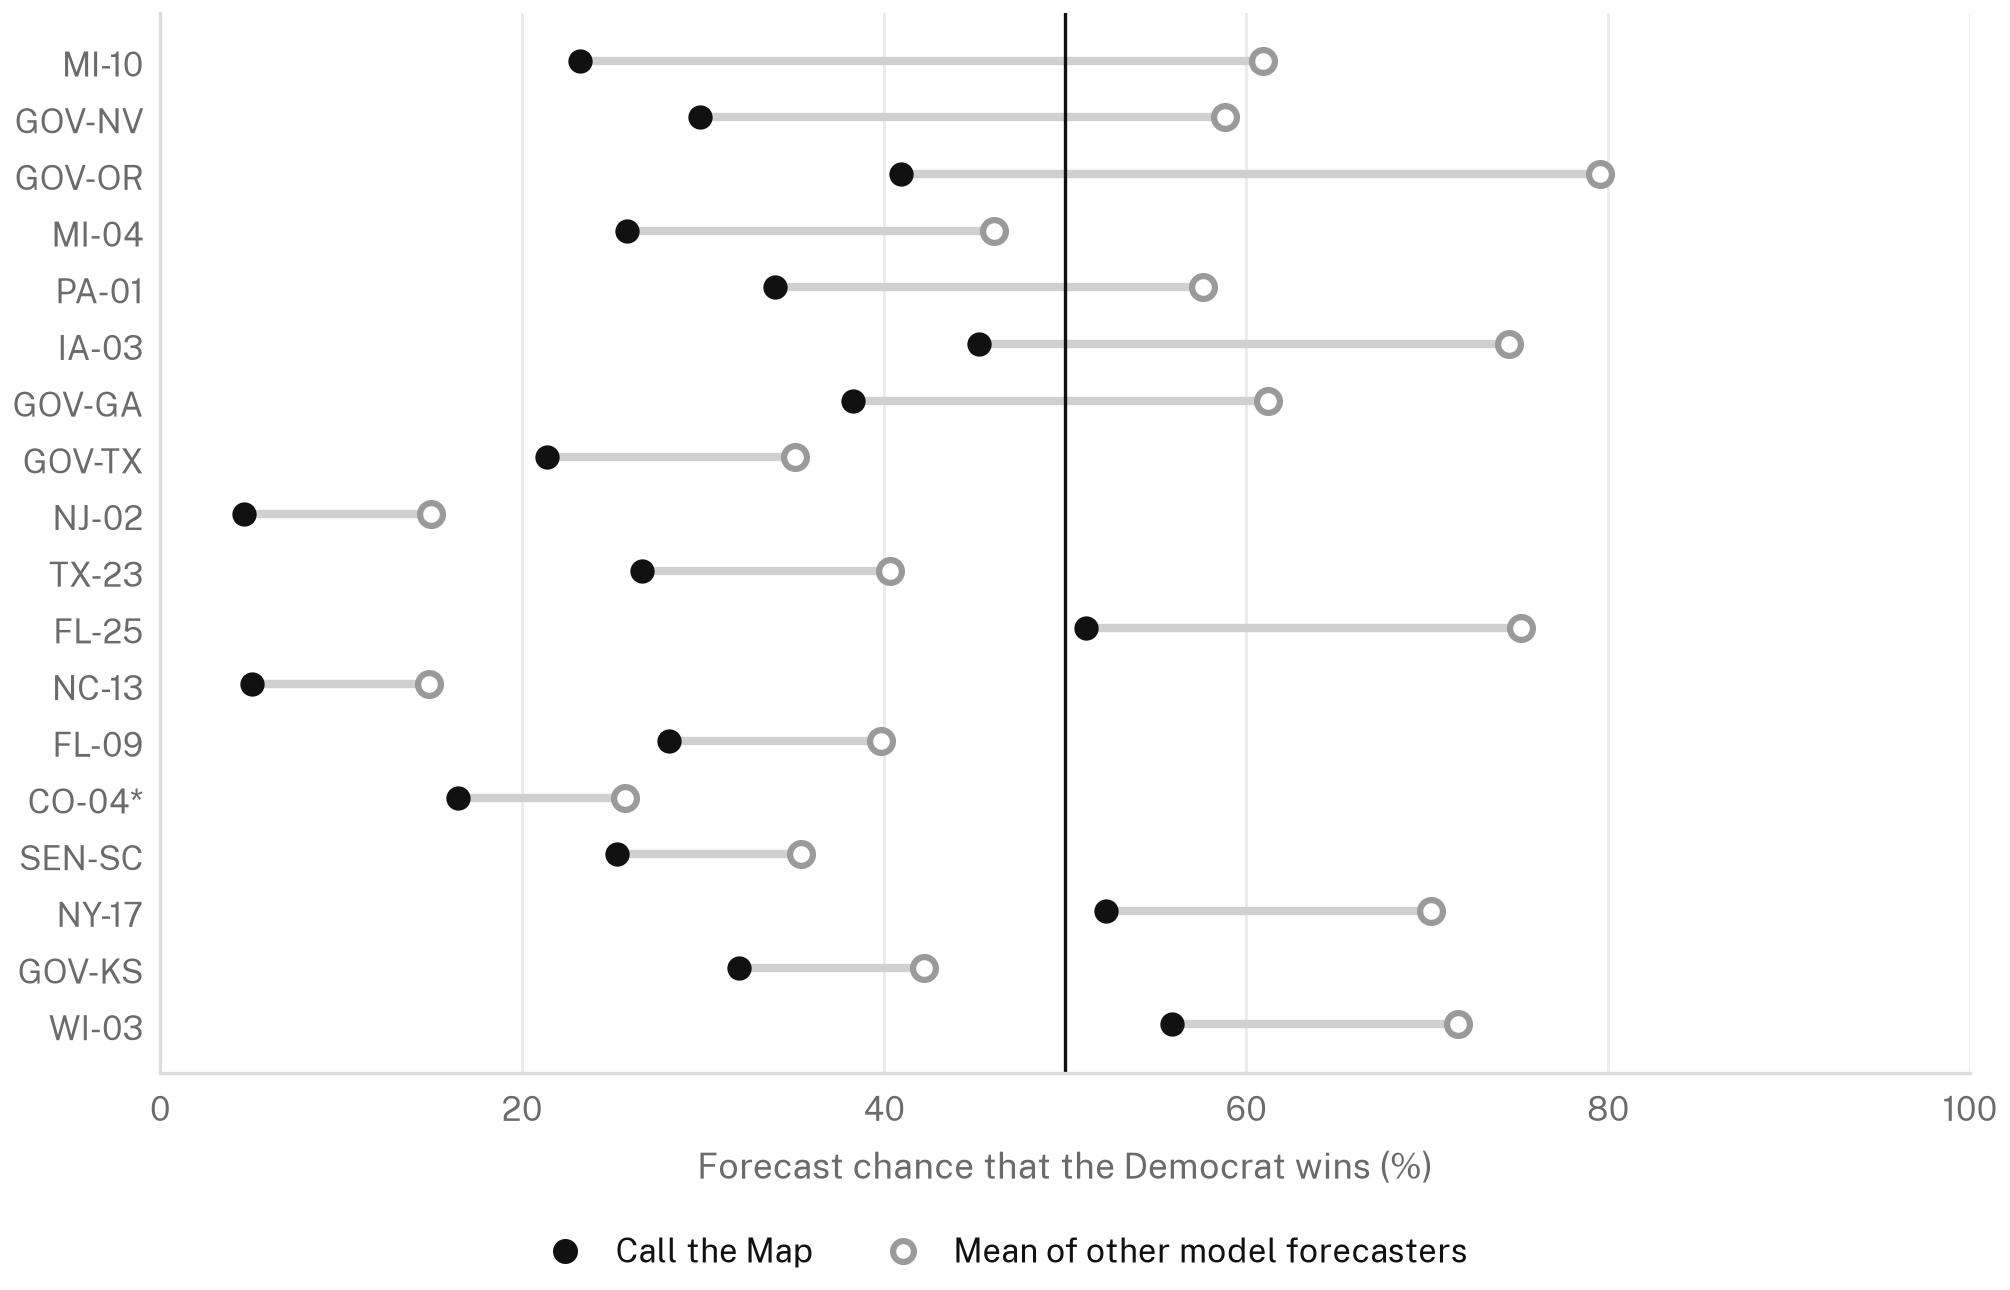
Table 22. The 15 costliest races relative to the mean of the other models. The top 10 hold 49% of our total excess of 5.32 Brier points summed over 486 races, and the top 25 hold 85%.
| Race | Our rating | Our P(D) | Other models' mean P(D) | Brier excess over the field mean | Our margin error | Field margin error | Race polls |
|---|---|---|---|---|---|---|---|
| MI-10 | Lean R | 23% | 61% | 0.437 | −11.4 | −5.4 | 2 |
| GOV-NV | Lean R | 30% | 59% | 0.323 | −10.5 | −5.9 | 15 |
| GOV-OR | Tilt R | 41% | 80% | 0.307 | −10.9 | −2.7 | 6 |
| MI-04 | Lean R | 26% | 46% | 0.260 | −5.1 | −2.8 | 5 |
| PA-01 | Tilt R | 34% | 58% | 0.256 | −7.8 | −4.6 | 8 |
| IA-03 | Tilt R | 45% | 74% | 0.235 | −7.9 | −3.1 | 1 |
| GOV-GA | Tilt R | 38% | 61% | 0.231 | −10.6 | −6.8 | 20 |
| GOV-TX | Lean R | 21% | 35% | 0.197 | −11.7 | −10.1 | 65 |
| NJ-02 | Likely R | 5% | 15% | 0.187 | −12.4 | −9.7 | 1 |
| TX-23 | Lean R | 27% | 40% | 0.182 | −11.9 | −9.8 | 2 |
| FL-25 | Tilt D | 51% | 75% | 0.177 | −4.4 | −0.5 | 4 |
| NC-13 | Likely R | 5% | 15% | 0.176 | −12.3 | −9.6 | 0 |
| FL-09 | Lean R | 28% | 40% | 0.155 | −3.6 | −2.0 | 2 |
| CO-04* | Lean R | 16% | 26% | 0.146 | −6.1 | −5.5 | 1 |
| SEN-SC | Lean R | 25% | 35% | 0.142 | −8.3 | −6.5 | 18 |
The costliest races are lean and tilt Republican calls that Democrats won, and thinly polled House districts are over-represented. The 104 races with one to four polls account for 2.44 of the 5.32 excess, where the 311 unpolled races account for 0.28. One or two polls, most of them from Democratic sponsors and each read two points more Republican by the sponsor rule, were given most of the weight in a race. The backtest's single-poll weight cap addresses this and is among the few fixes that passed (section 9).
7.7 Interval coverage
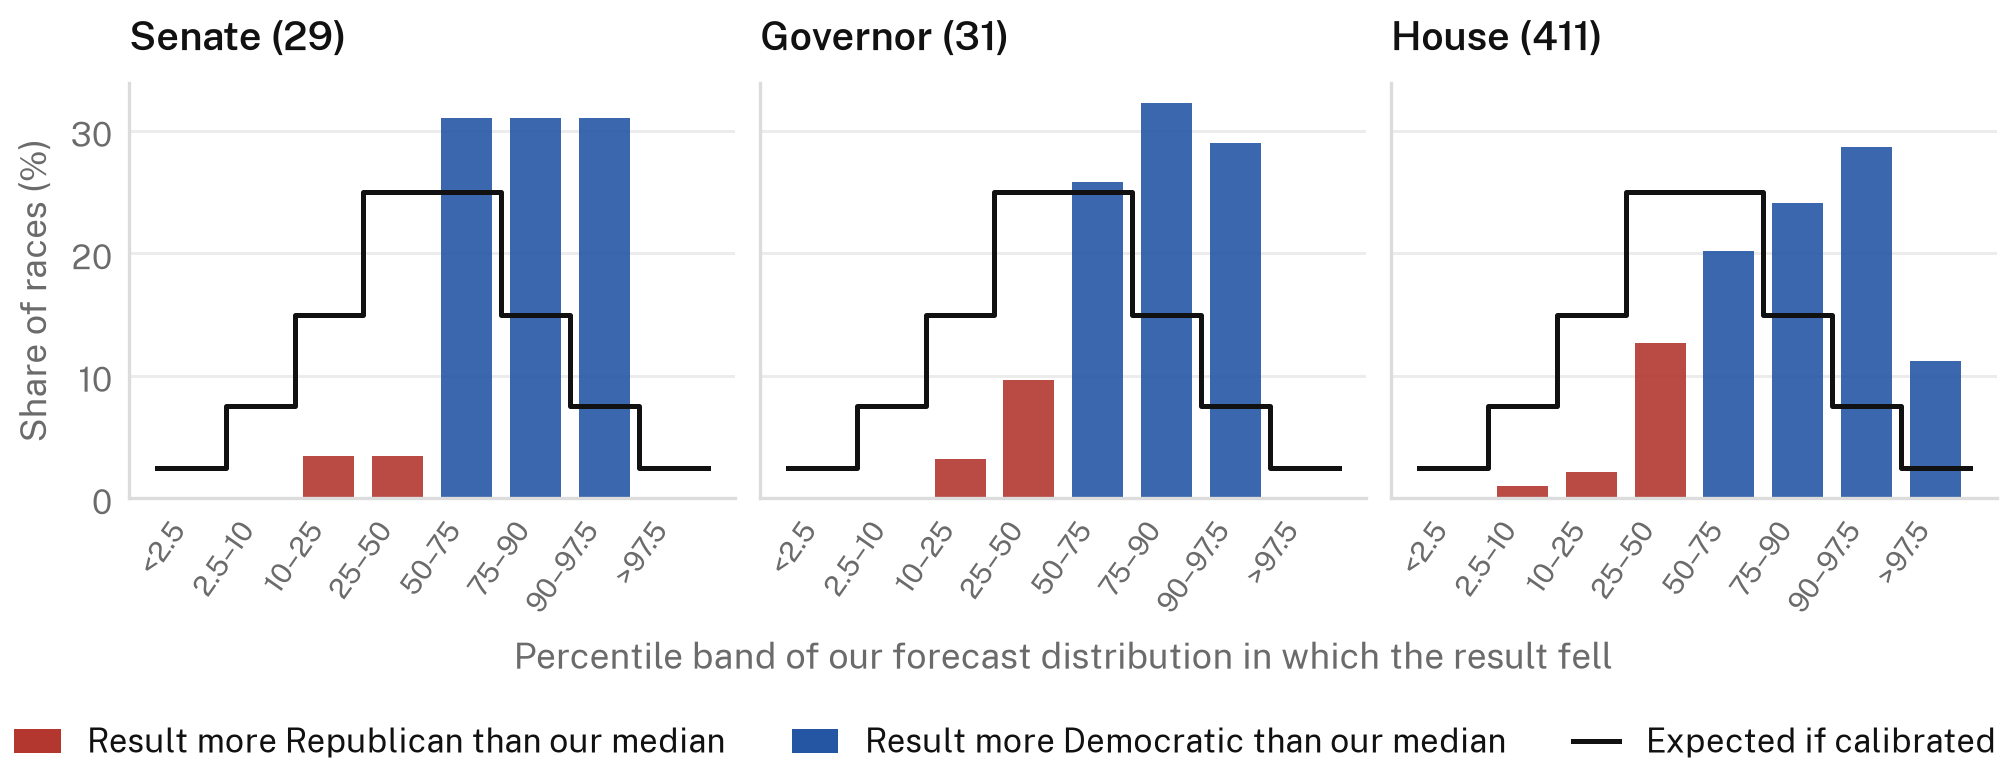
Table 23. Coverage of our two-party intervals, as published and after removing each office's mean error.
| Office | Races | 50% | 80% | 95% | Result above the 80% interval (more Democratic) | Below | Mean error removed | 50% after | 80% after | 95% after | Mean 80% width (points) |
|---|---|---|---|---|---|---|---|---|---|---|---|
| Senate | 29 | 34% | 69% | 100% | 31% | 0% | −5.5 | 69% | 97% | 100% | 18.8 |
| Governor | 31 | 35% | 71% | 100% | 29% | 0% | −5.5 | 65% | 94% | 100% | 16.3 |
| House | 411 | 33% | 59% | 89% | 40% | 1% | −6.6 | 47% | 82% | 97% | 16.2 |
| All three | 471 | 33% | 61% | 90% | 39% | 1% | −6.5 | 49% | 83% | 97% | 16.4 |
The 80% intervals covered 61% of results and the 50% intervals 33%. Of all results, 39% were above the 80% interval and 0.8% below. The Senate and governor 95% intervals covered every race, and the House 95% intervals 89%. This is the race-level face of section 5.9: the intervals put too little of their width into error shared across races.
8. Error anatomy
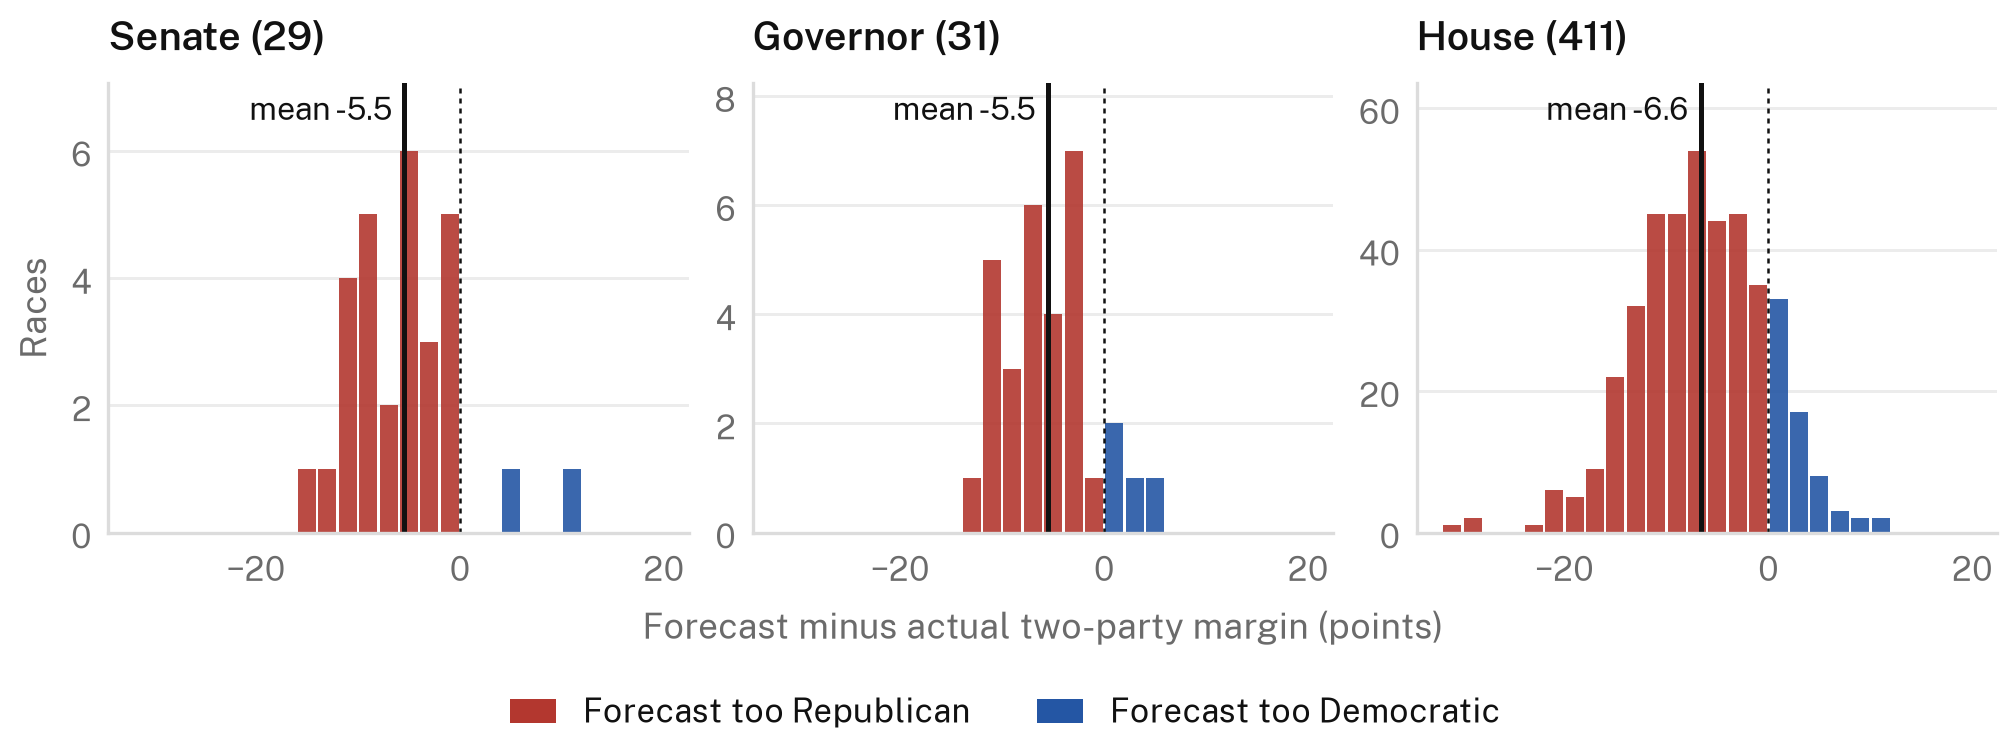
The forecast was too Republican in 93% of Senate races, 87% of governor races and 84% of House races.
8.1 Variance decomposition
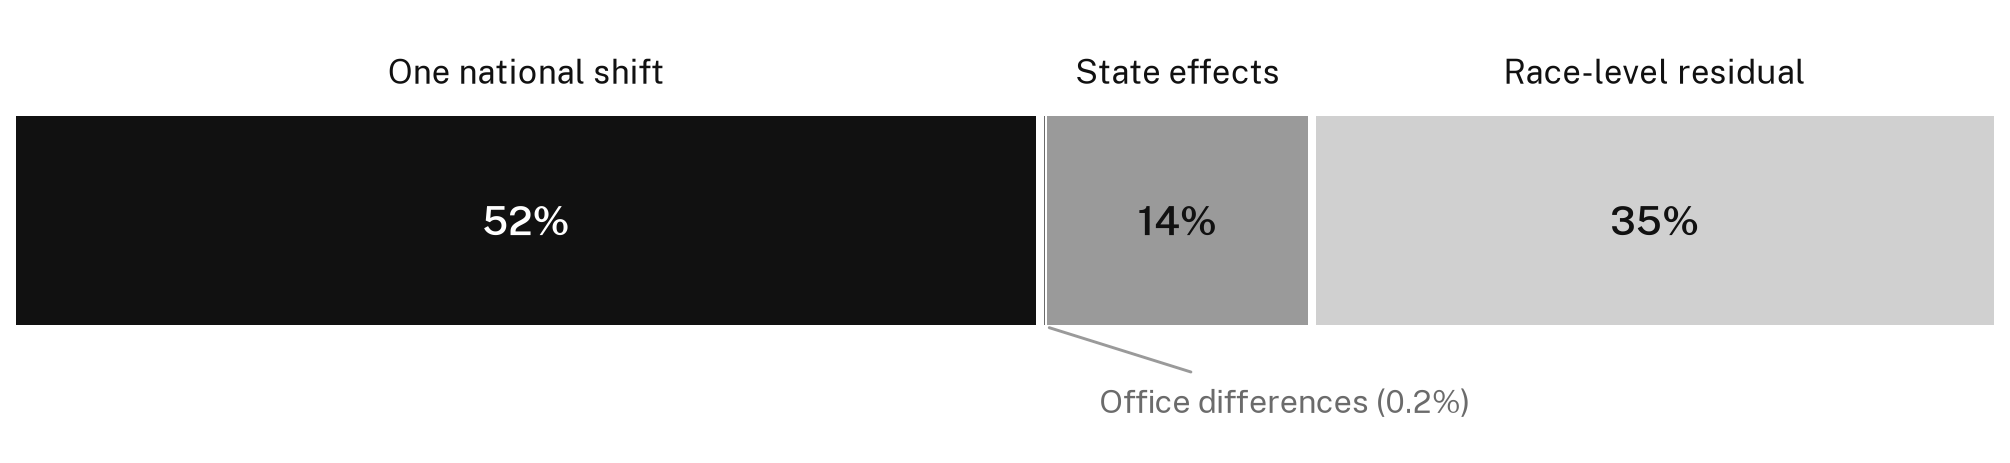
The mean squared error is split into four parts: the square of the overall mean error; the spread of the three office means around it; a state component estimated by one-way random-effects analysis of variance on office-centered errors, which removes the race-level noise that averages into small states' means; and the race-level remainder.
Table 24. Variance decomposition of margin error under three definitions.
| Panel | Races | RMSE (points) | Mean error | One national shift | Office differences | State effects | Race-level residual | State SD (points) | Race SD (points) |
|---|---|---|---|---|---|---|---|---|---|
| Two-party margins, leaders hold | 471 | 8.96 | −6.47 | 51.7% | 0.2% | 13.5% | 34.5% | 3.31 | 5.28 |
| Two-party margins, called races only | 460 | 8.97 | −6.45 | 51.4% | 0.2% | 13.3% | 35.2% | 3.28 | 5.33 |
| All-vote headline margins, leaders hold | 471 | 8.75 | −6.38 | 52.8% | 0.2% | 13.4% | 33.6% | 3.21 | 5.09 |
One national shift is 52% of the squared error. The offices differ by almost nothing once the national shift is removed (0.2%): the Senate, governor and House means are −5.5, −5.5 and −6.6. State effects are 14%, a standard deviation of 3.3 points from state to state. The race-level remainder is 35%, a standard deviation of 5.3 points. The split barely changes on called races alone or on all-vote margins.
8.2 States and regions
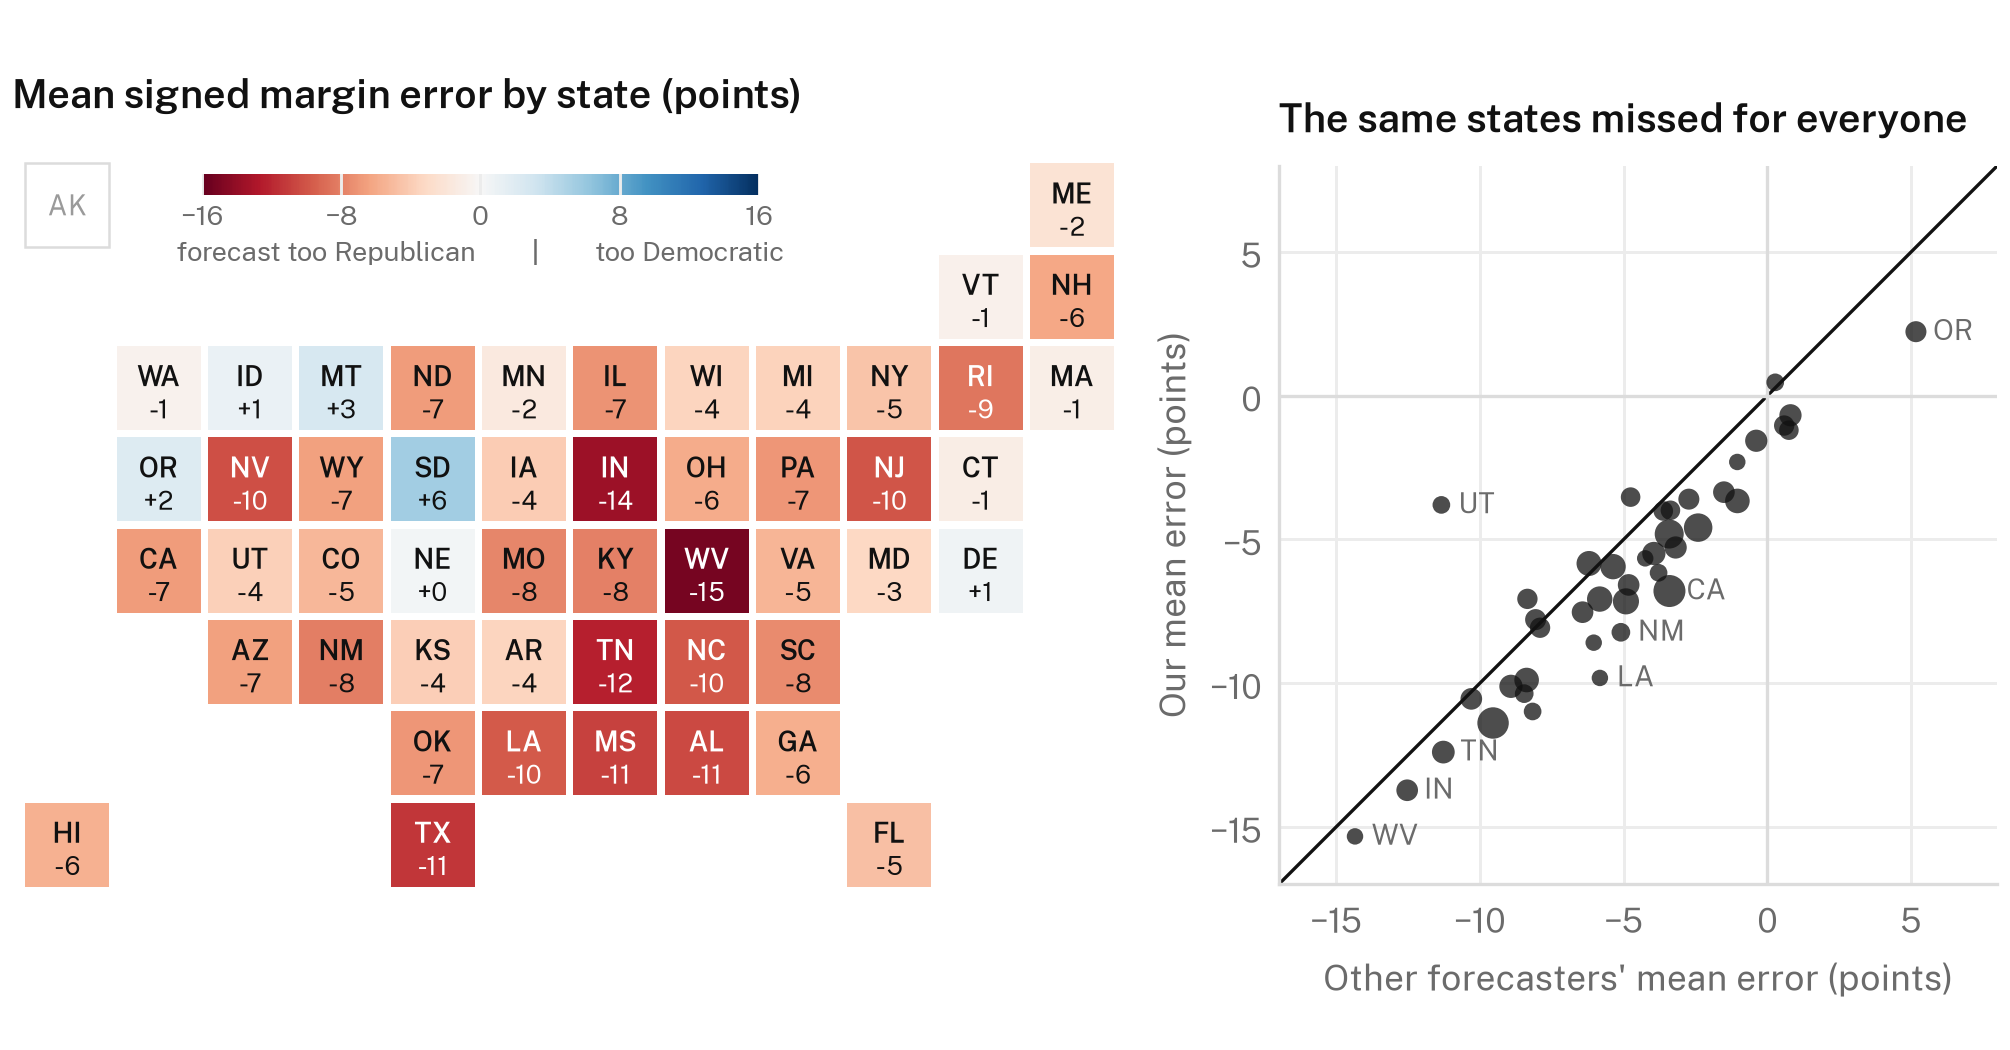
The state pattern was common to the field. Across the 42 states with three or more races, the correlation between our state mean error and the other models' is 0.90, and at race level the correlation of errors is 0.81 over 471 races. The largest misses were in the South, where our mean error was −8.1 points over 182 races and the field's −7.0. In the other three regions our mean error was between −5.1 and −5.4 and the field's between −3.2 and −4.2. Appendix C lists every state.
8.3 By race characteristics
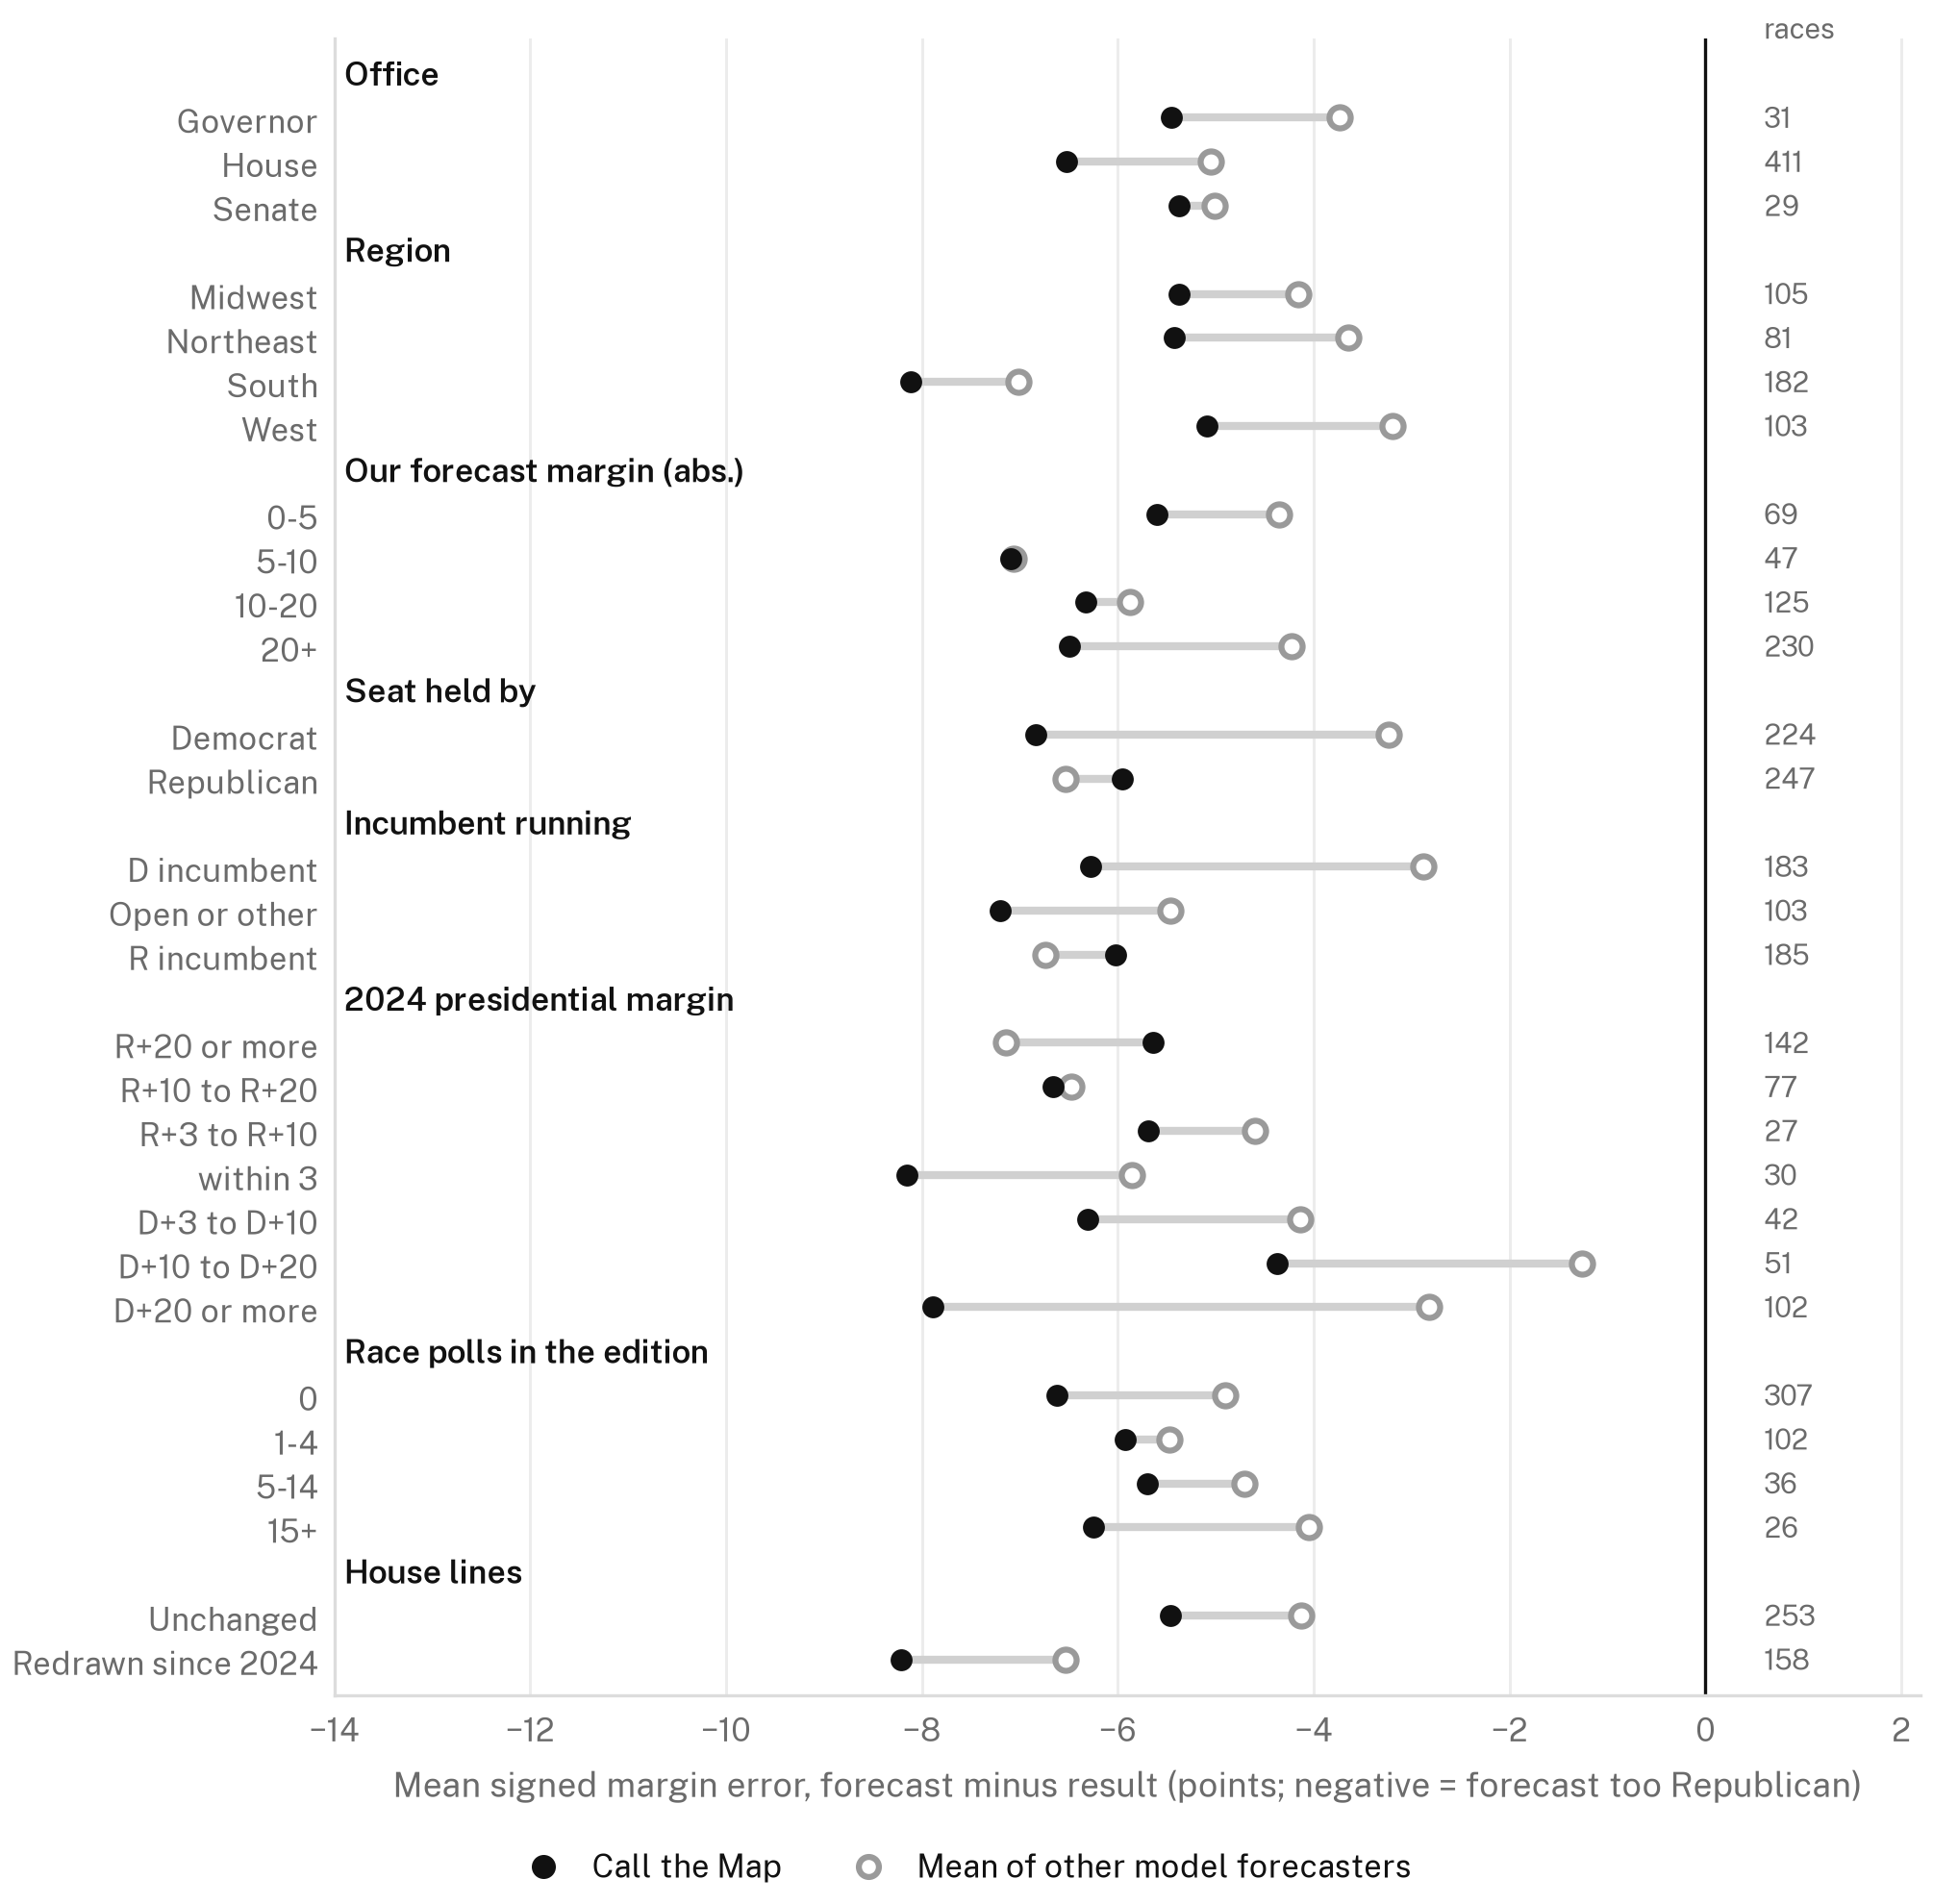
Table 25. Error by group: margins on the races where the other models also published a margin, and probabilities on scored races.
| Split | Group | Margin races | Our mean error | Our MAE | Field mean error | Field MAE | Probability races | Our Brier | Field Brier | Our wrong calls | Field wrong calls |
|---|---|---|---|---|---|---|---|---|---|---|---|
| Office | Senate | 29 | −5.4 | 6.49 | −5.0 | 5.61 | 35 | 0.0785 | 0.0610 | 3 | 2 |
| Governor | 31 | −5.5 | 6.02 | −3.7 | 4.40 | 36 | 0.0767 | 0.0433 | 5 | 2 | |
| House | 411 | −6.5 | 7.30 | −5.1 | 6.07 | 415 | 0.0507 | 0.0423 | 28 | 24 | |
| Census region | Midwest | 105 | −5.4 | 6.29 | −4.2 | 4.89 | 107 | 0.0632 | 0.0471 | 11 | 8 |
| Northeast | 81 | −5.4 | 6.30 | −3.7 | 4.98 | 83 | 0.0309 | 0.0210 | 2 | 1 | |
| South | 182 | −8.1 | 8.34 | −7.0 | 7.07 | 185 | 0.0728 | 0.0642 | 18 | 16 | |
| West | 103 | −5.1 | 6.66 | −3.2 | 5.71 | 111 | 0.0337 | 0.0232 | 5 | 3 | |
| Absolute forecast margin (points) | 0-5 | 69 | −5.6 | 5.79 | −4.3 | 4.41 | 72 | 0.2217 | 0.1561 | 24 | 16 |
| 5-10 | 47 | −7.1 | 7.30 | −7.1 | 7.14 | 48 | 0.1421 | 0.1291 | 8 | 8 | |
| 10-20 | 125 | −6.3 | 7.17 | −5.9 | 6.58 | 128 | 0.0283 | 0.0289 | 4 | 4 | |
| 20+ | 230 | −6.5 | 7.55 | −4.2 | 5.79 | 238 | 0.0006 | 0.0004 | 0 | 0 | |
| Seat held by | Democrat | 224 | −6.8 | 7.64 | −3.2 | 4.83 | 227 | 0.0194 | 0.0130 | 7 | 4 |
| Republican | 247 | −6.0 | 6.74 | −6.5 | 6.92 | 259 | 0.0855 | 0.0706 | 29 | 24 | |
| Incumbent | D incumbent | 183 | −6.3 | 7.19 | −2.9 | 4.61 | 184 | 0.0114 | 0.0064 | 3 | 2 |
| Open or other | 103 | −7.2 | 7.76 | −5.5 | 6.33 | 108 | 0.0663 | 0.0500 | 11 | 7 | |
| R incumbent | 185 | −6.0 | 6.81 | −6.7 | 7.01 | 194 | 0.0891 | 0.0755 | 22 | 19 | |
| 2024 presidential margin | R+20 or more | 142 | −5.6 | 6.86 | −7.1 | 7.63 | 150 | 0.0130 | 0.0135 | 2 | 2 |
| R+10 to R+20 | 77 | −6.7 | 6.72 | −6.5 | 6.49 | 81 | 0.1982 | 0.1752 | 22 | 20 | |
| R+3 to R+10 | 27 | −5.7 | 5.95 | −4.6 | 4.64 | 27 | 0.2243 | 0.1489 | 9 | 6 | |
| within 3 | 30 | −8.2 | 8.28 | −5.9 | 6.14 | 30 | 0.0599 | 0.0254 | 2 | 0 | |
| D+3 to D+10 | 42 | −6.3 | 7.07 | −4.1 | 5.24 | 43 | 0.0065 | 0.0023 | 0 | 0 | |
| D+10 to D+20 | 51 | −4.4 | 6.40 | −1.3 | 4.07 | 52 | 0.0068 | 0.0009 | 1 | 0 | |
| D+20 or more | 102 | −7.9 | 8.34 | −2.8 | 4.63 | 103 | 0.0005 | 0.0008 | 0 | 0 | |
| Race polls in the edition | 0 | 307 | −6.6 | 7.54 | −4.9 | 6.15 | 311 | 0.0127 | 0.0118 | 4 | 4 |
| 1-4 | 102 | −5.9 | 6.70 | −5.5 | 6.13 | 104 | 0.1317 | 0.1083 | 20 | 16 | |
| 5-14 | 36 | −5.7 | 5.89 | −4.7 | 4.77 | 41 | 0.1259 | 0.0974 | 7 | 6 | |
| 15+ | 26 | −6.2 | 6.38 | −4.0 | 4.18 | 30 | 0.1245 | 0.0768 | 5 | 2 | |
| House district lines | Unchanged since 2024 | 253 | −5.5 | 6.50 | −4.1 | 5.33 | 255 | 0.0386 | 0.0295 | 13 | 11 |
| Redrawn since 2024 | 158 | −8.2 | 8.57 | −6.5 | 7.25 | 160 | 0.0700 | 0.0626 | 15 | 13 |
Four patterns stand out. First, the party holding the seat. Our error was similar in Democratic-held and Republican-held seats (−6.8 and −6.0), where the field's was −3.2 and −6.5. The same shows in seats that voted Democratic for president by 20 points or more: −7.9 for us and −2.8 for the field over 102 races. These are safe seats and cost almost nothing in probability terms, and they are a large part of our margin MAE deficit.
Second, competitiveness. In the 72 races we had within five points our Brier score was 0.222 against the field mean's 0.156, with 24 wrong calls against 16. That band holds 89% of our total excess over the field. Beyond ten points the two are equal.
Third, polling volume. Our margin error did not shrink with more polls: −6.6 with none and −6.2 with 15 or more. The field's did, to −4.0. The heavily polled races are the Senate and governor races where the poll-bias shift applied.
Fourth, redrawn House lines, covered in section 7.4.
Incumbency shows no pattern of its own beyond the party holding the seat. Open seats missed by a little more (−7.2).
9. Counterfactuals and backtests
The first postmortem proposed fixes and then backtested them under a protocol committed before any result was read (BACKTEST.md). Each fix was fitted on cycles before each test cycle and scored at election eve on the House in 2018 to 2024 and on the Senate and governors in 2012 to 2024, then applied to 2026 as one more held-out cycle. Its numbers are on the November 7 results snapshot and are quoted here as that document reports them.
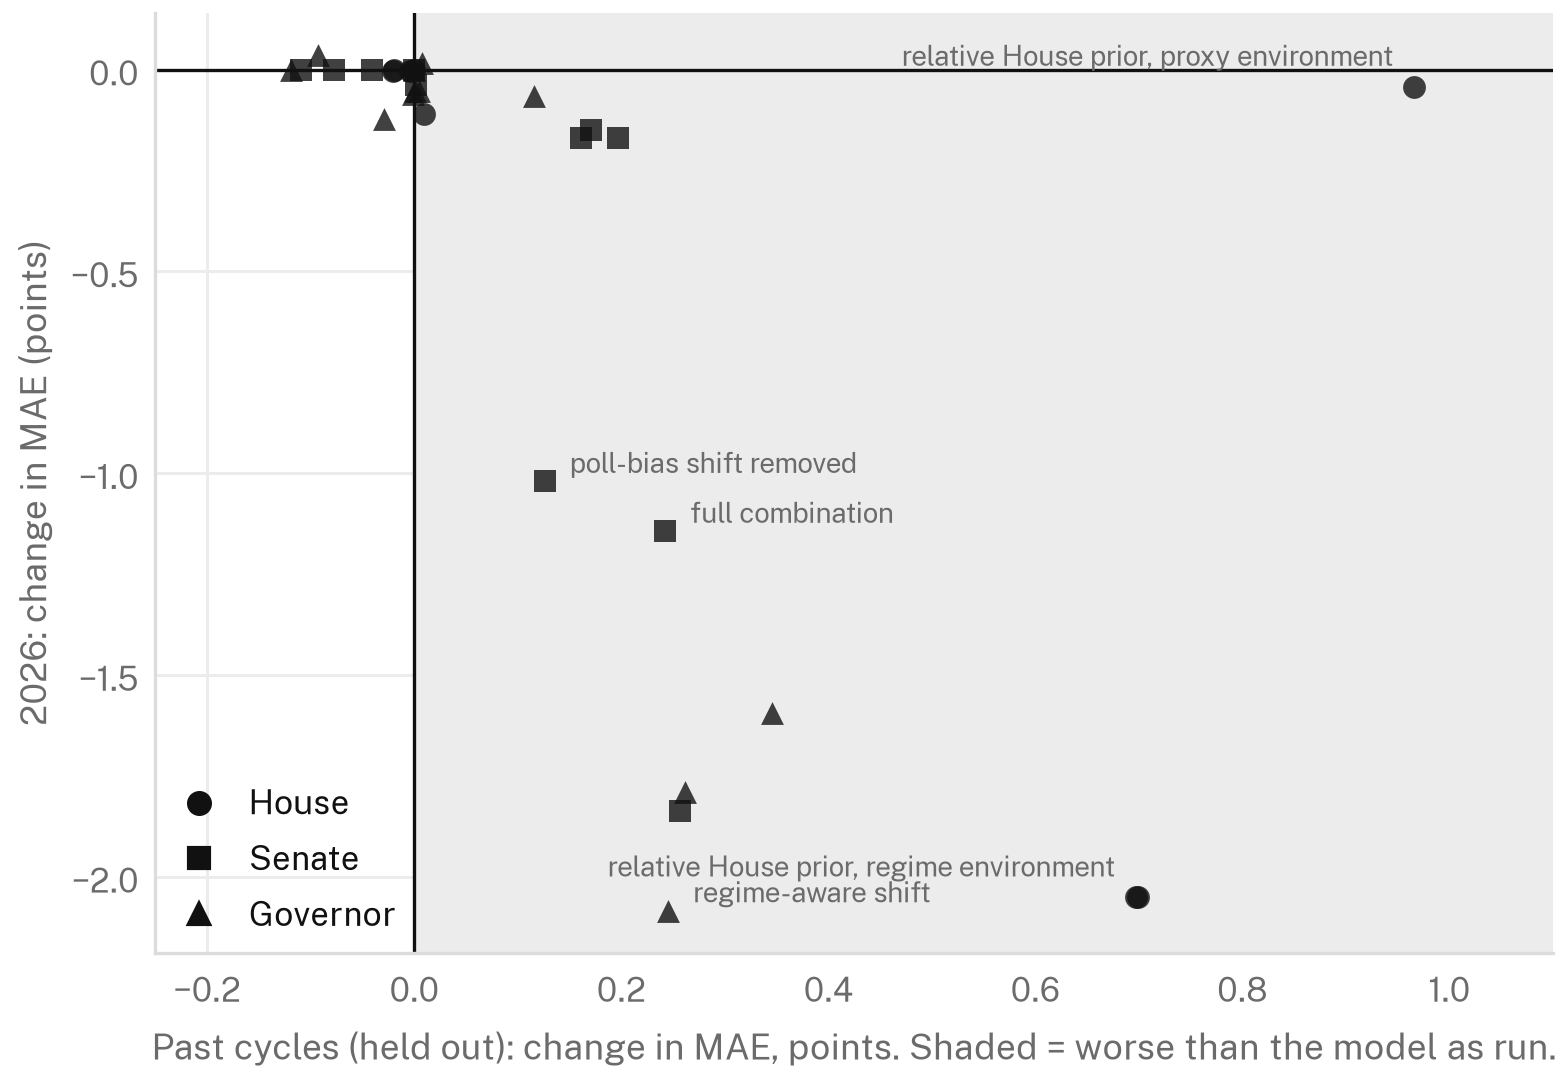
Table 26. The backtested fixes. Changes are the variant minus the model as run; negative is better. The last column is the recommendation BACKTEST.md reached under its preregistered rule.
| Fix | Office | Past MAE change | Past Brier change | Past cycles with lower MAE | 2026 MAE change | 2026 Brier change | Verdict in BACKTEST.md |
|---|---|---|---|---|---|---|---|
| Remove the poll-bias shift | Senate | +0.13 | −0.0019 | 2 of 7 | −1.02 | −0.0210 | Overfit risk |
| Remove the poll-bias shift | Governor | +0.35 | +0.0074 | 2 of 7 | −1.59 | −0.0350 | Overfit risk |
| Regime-aware poll-bias shift | Senate | +0.26 | +0.0008 | 2 of 7 | −1.84 | −0.0327 | Overfit risk |
| Regime-aware poll-bias shift | Governor | +0.25 | +0.0112 | 3 of 7 | −2.08 | −0.0438 | Overfit risk |
| House prior relative to the national margin, proxy environment | House | +0.97 | +0.0033 | 1 of 4 | −0.04 | +0.0007 | Reject |
| House prior relative to the national margin, regime environment | House | +0.70 | −0.0020 | 1 of 4 | −2.05 | −0.0068 | Overfit risk |
| Regime generic-ballot environment | Senate | +0.17 | +0.0003 | 2 of 7 | −0.15 | +0.0002 | Reject |
| Regime generic-ballot environment | Governor | −0.00 | −0.0000 | 2 of 7 | −0.06 | +0.0000 | No measurable effect |
| Uncertainty re-split (shared and race-specific) | House | +0.00 | −0.0003 | centers unchanged | +0.00 | −0.0005 | Adopt |
| Uncertainty re-split (shared and race-specific) | Senate | +0.00 | +0.0008 | centers unchanged | +0.00 | −0.0035 | Neutral; 2026 gain only |
| Uncertainty re-split (shared and race-specific) | Governor | +0.00 | +0.0017 | centers unchanged | +0.00 | +0.0002 | Reject |
| Shorter poll half-life near the election | House | −0.02 | −0.0005 | 2 of 4 | +0.00 | +0.0000 | Adopt (small) |
| Shorter poll half-life near the election | Senate | −0.04 | +0.0002 | 1 of 7 | +0.00 | +0.0000 | Adopt (small) |
| Shorter poll half-life near the election | Governor | −0.09 | +0.0003 | 2 of 7 | +0.04 | −0.0014 | Adopt (small) |
| Single-poll weight cap | House | −0.00 | −0.0002 | 3 of 4 | −0.00 | −0.0002 | Adopt |
| Single-poll weight cap | Senate | −0.08 | −0.0000 | 3 of 7 | +0.00 | +0.0000 | Adopt |
| Single-poll weight cap | Governor | −0.12 | +0.0000 | 4 of 7 | +0.00 | +0.0000 | Adopt |
| No sponsor adjustment | House | +0.01 | +0.0001 | 1 of 4 | −0.11 | −0.0048 | Neutral; 2026 gain only |
| No sponsor adjustment | Senate | +0.00 | +0.0000 | 1 of 7 | −0.04 | +0.0010 | Neutral; 2026 gain only |
| No sponsor adjustment | Governor | +0.01 | −0.0011 | 1 of 7 | +0.02 | −0.0045 | Adopt (marginal) |
| Governor safe-seat evidence term | Governor | +0.12 | +0.0005 | 2 of 7 | −0.06 | −0.0043 | Overfit risk |
| Full combination | House | +0.70 | −0.0005 | 1 of 4 | −2.05 | −0.0066 | Overfit risk |
| Full combination | Senate | +0.24 | −0.0004 | 1 of 7 | −1.14 | −0.0257 | Overfit risk |
| Full combination | Governor | +0.26 | +0.0064 | 4 of 7 | −1.79 | −0.0318 | Overfit risk |
The result is plain. Every fix that would have repaired 2026 fails the earlier cycles, and every fix that passes the earlier cycles barely moves 2026.
Removing the poll-bias shift improves 2026 by 1.02 points of Senate MAE and 1.59 of governor MAE, and costs 0.13 and 0.35 points over the seven earlier cycles, where removal lowers MAE in 2 of 7 Senate cycles and 2 of 7 governor cycles. A regime-aware version does worse in the past than plain removal. Re-specifying the House prior so that the environment carries the national level improves the 2026 House MAE by 2.05 points and worsens the four earlier cycles by 0.70. BACKTEST.md reports that the same re-specification fails the earlier cycles even when it is handed the realized national vote.
The fixes that pass are small: a cap on the weight of a single poll, a shorter half-life near the election, a re-split of House uncertainty into shared and race-specific parts, and dropping the sponsor adjustment for governors. BACKTEST.md re-scored 2026 with that adopted set and found that it would still have ranked last or next to last in every chamber. The set that would have ranked mid-pack is the set that fails 2012 to 2024.
The ablations in section 5 agree with this from a different direction. The poll-bias shift lowered MAE in 3 of 7 past governor cycles. The sponsor adjustment and the half-life were neutral or mildly helpful before 2026. Both lines of evidence say the same thing: the model's Republican-leaning corrections were reasonable bets on the record through 2024 and lost in 2026, and that one election does not show they will lose again.
A second backtest covers two further fixes: a zero-mean poll-bias term carried as shared uncertainty, and a prior for redrawn House districts. It was not finished when this report was built, so its verdicts are not cited here.
10. Limitations
One election is one draw of a correlated outcome. The races share a national error, so 486 races are far fewer than 486 independent tests. The state-clustered intervals in this report are narrower than the true uncertainty about any general claim. A single cycle can show that this forecast was the least accurate of those captured. It cannot show that the model is worse than the others in general, and it cannot show that any component is harmful in general.
Counts are not final. 22 races are uncalled, 8 of them within a point, and only 202 of 481 called races are at 98% counted or more. Ranks were stable across the treatments in section 3.2. Levels will move, and margins in slow-counting states will move most.
The comparison set is what was captured. Twelve other models were captured on one day, and the prediction markets captured with them are not ranked. Forecasters that were not captured are not ranked. The other sources' final captures are from about 22:40 UTC, five and a half hours after our freeze, though the first postmortem found no change in ranks at a common cutoff. The mean of other forecasters used as a benchmark changes membership from race to race, because sources cover different races.
The baselines' probability widths rest on six cycles. A different window would change their Brier scores somewhat and would not change their margin errors.
The ablations hold the post-stack calibration and the published intervals fixed, and they score with a normal approximation. They isolate the effect of a component on the center. They do not measure what a fully refitted model without the component would have published for its intervals. The past-cycle column is rolling-origin, and the components were still chosen by people who had seen those cycles.
The environment and elasticity counterfactuals are arithmetic on the published parts. They are not refits.
The trajectory before October 6 is restated with the current method on each day's inputs. The published forecast on those days came from the same model family with earlier settings.
The independent, ranked-choice and runoff groups have between 6 and 26 races each. Nothing in section 5.8 or 6.4 is distinguishable from chance.
Silver Bulletin's scores come from its subscriber forecasts as captured on November 3; its race-by-race numbers are not printed.
11. Conclusions
The final forecast was the least accurate probability forecast of the seven all-office sources, under every treatment of the uncalled races. Its probabilities leaned further toward Republicans, on average, than those of any other all-office source (6.7 points of mean win probability), in a year when every forecaster was too Republican.
About half of the squared error was one national shift that no captured forecaster avoided. Our distance from the middle of the field was mostly level as well: 1.5 points of extra Republican lean in the House and 1.7 in governor races. The components that produced it are identified: a House elasticity of 0.31, a generic-ballot mapping that lowered a D+8.3 reading, a poll-bias shift of 1.6 to 2.5 points toward Republicans, a sponsor rule that pushed Democratic-sponsored House polls further from the result, and a long poll half-life.
The House model added nothing measurable in 2026 over presidential lean plus the generic ballot. The Senate model added a great deal over every baseline, and the governor model added accuracy on margins.
The forecast's statements about chambers were sound as probability statements. The seat results fell inside the 95% intervals and at the edge of the 80% intervals, because the joint simulation carried a shared error of about the size that occurred. The forecast improved steadily for eight weeks, and its final edition was its most accurate on margins.
No fix that repairs 2026 has passed the earlier cycles. The small fixes that passed should be adopted on their merits. The larger questions, a zero-mean poll-bias term carried as shared uncertainty and a prior for redrawn districts, are being backtested separately, and the 2026 result should count in those tests as one cycle among the others.
12. About this report
Call the Map prepared this report about its own forecast. Four things about it should be kept in mind.
It is provisional. 22 of the 506 races are not yet called, 8 of them within a point, and two Louisiana seats go to runoffs on December 12. Every number here will be rebuilt when the results are certified, and some will move.
The other forecasters are scored from what was captured from their public pages on November 3, with each one's own definitions of margin and interval, some of them derived here from vote shares. Appendix C lists every source with its capture time. A forecaster who reads its own numbers differently is the authority on its own forecast.
Silver Bulletin is scored like every other forecaster, from its subscriber forecasts as we captured them on November 3. Its race-by-race numbers are not ours to redistribute, so the report prints its scores and none of its race-by-race probabilities or margins. Prediction markets are not ranked: they are prices, not forecasts.
The unflattering findings are stated as plainly as the favorable ones. The House model did not beat a two-line baseline, and we were right in 1 of 10 disagreements with the consensus of the other forecasters.
Appendix A. Race-level results
Table A1. Races not called at the pinned commit, with the leader that the headline scores assign as the outcome.
| Race | Leader | Current margin (D minus R) | Our P(Republican loses) | Note |
|---|---|---|---|---|
| GOV-AK | D | D+21.4 | 87% | |
| AK-AL | R | n/a | 35% | |
| AZ-02 | R | R+1.0 | 25% | |
| CA-04 | D | n/a | 100% | no Republican-versus-other contest; not scored |
| CA-23 | R | R+1.6 | 3% | |
| CA-40 | R | n/a | 0% | no Republican-versus-other contest; not scored |
| CO-04 | D | D+0.9 | 16% | |
| FL-10 | D | n/a | 100% | no Republican-versus-other contest; not scored |
| FL-27 | R | R+0.4 | 19% | |
| LA-05 | D | D+0.7 | 1% | runoff December 12; excluded |
| LA-06 | D | D+0.3 | 1% | runoff December 12; excluded |
| MA-02 | D | n/a | 100% | no Republican-versus-other contest; not scored |
| MA-05 | D | n/a | 100% | no Republican-versus-other contest; not scored |
| MA-07 | D | n/a | 100% | no Republican-versus-other contest; not scored |
| MN-01 | D | D+0.1 | 39% | |
| NC-03 | D | D+0.1 | 12% | |
| NC-05 | D | D+0.1 | 4% | |
| NC-07 | R | R+0.7 | 7% | |
| NC-10 | R | R+0.8 | 3% | |
| TN-04 | D | D+0.1 | 1% | |
| WA-05 | R | R+4.4 | 12% | |
| SEN-AK | D | D+2.3 | 51% |
Table A2. Every forecast race. P(Republican loses) is one minus our published P(Republican wins). Margins are all-vote, Democratic minus Republican, as published on the site; in races without a Democrat-versus-Republican pairing the actual margin is not defined on this basis. Error is forecast minus actual. The call is a hit when the side we gave more than 50% won or leads.
| Race | Rating | P(Republican loses) | Forecast margin | 80% interval | Actual margin | Error | In 80% | Winner | Call |
|---|---|---|---|---|---|---|---|---|---|
| SEN-AK | n/a | 51.5% | D+0.9 | n/a | D+2.3 | −1.4 | D leads | hit | |
| SEN-AL | Solid R | 0.7% | R+18.5 | R+26.7 to R+10.3 | R+9.5 | −9.0 | out | R | hit |
| SEN-AR | Solid R | 4.8% | R+12.4 | R+21.6 to R+3.2 | R+11.8 | −0.6 | in | R | hit |
| SEN-CO | Solid D | 99.6% | D+20.3 | D+12.2 to D+28.4 | D+25.5 | −5.2 | in | D | hit |
| SEN-DE | Solid D | 99.5% | D+32.8 | D+19.4 to D+46.2 | D+27.2 | +5.6 | in | D | hit |
| SEN-FL | Likely R | 7.1% | R+8.5 | R+15.8 to R+1.2 | R+2.9 | −5.7 | in | R | hit |
| SEN-GA | Likely D | 92.8% | D+8.6 | D+1.2 to D+16.0 | D+18.1 | −9.4 | out | D | hit |
| SEN-IA | Tilt R | 44.4% | R+0.8 | R+8.3 to D+6.8 | D+4.2 | −5.0 | in | D | miss |
| SEN-ID | n/a | 8.7% | n/a | n/a | n/a | n/a | R | hit | |
| SEN-IL | Solid D | 97.3% | D+13.5 | D+5.1 to D+21.9 | D+25.3 | −11.8 | out | D | hit |
| SEN-KS | Tilt D | 61.9% | D+1.7 | R+5.8 to D+9.1 | D+5.1 | −3.4 | in | D | hit |
| SEN-KY | Solid R | 7.1% | R+13.8 | R+25.7 to R+2.0 | R+12.1 | −1.8 | in | R | hit |
| SEN-LA | Likely R | 8.0% | R+12.3 | R+23.5 to R+1.2 | R+1.8 | −10.6 | in | R | hit |
| SEN-MA | Solid D | 100.0% | D+29.9 | D+22.2 to D+37.7 | D+31.3 | −1.3 | in | D | hit |
| SEN-ME | Tilt D | 61.3% | D+1.6 | R+6.1 to D+9.4 | D+6.1 | −4.5 | in | D | hit |
| SEN-MI | Tilt D | 66.5% | D+2.4 | R+5.2 to D+9.9 | D+7.0 | −4.6 | in | D | hit |
| SEN-MN | Lean D | 75.1% | D+3.7 | R+3.6 to D+11.0 | D+10.2 | −6.5 | in | D | hit |
| SEN-MS | n/a | 15.2% | R+9.0 | n/a | D+0.8 | −9.7 | D | miss | |
| SEN-MT | n/a | 6.0% | n/a | n/a | n/a | n/a | R | hit | |
| SEN-NC | Likely D | 94.5% | D+9.2 | D+2.1 to D+16.4 | D+19.7 | −10.5 | out | D | hit |
| SEN-NE | n/a | 30.0% | n/a | n/a | n/a | n/a | R | hit | |
| SEN-NH | Lean D | 84.7% | D+5.7 | R+1.6 to D+13.1 | D+13.8 | −8.0 | out | D | hit |
| SEN-NJ | Solid D | 99.2% | D+24.7 | D+13.4 to D+36.1 | D+27.5 | −2.8 | in | D | hit |
| SEN-NM | Solid D | 99.3% | D+18.0 | D+10.1 to D+25.9 | D+26.5 | −8.5 | out | D | hit |
| SEN-OH | Tilt D | 61.8% | D+1.7 | R+5.9 to D+9.3 | D+4.9 | −3.2 | in | D | hit |
| SEN-OK | Solid R | 0.8% | R+22.4 | R+32.7 to R+12.2 | R+17.9 | −4.5 | in | R | hit |
| SEN-OR | Solid D | 99.5% | D+29.9 | D+17.5 to D+42.3 | D+19.4 | +10.5 | in | D | hit |
| SEN-RI | Solid D | 99.9% | D+30.8 | D+22.0 to D+39.7 | D+37.5 | −6.7 | in | D | hit |
| SEN-SC | Lean R | 25.2% | R+3.8 | R+11.3 to D+3.8 | D+4.5 | −8.3 | out | D | miss |
| SEN-SD | n/a | 1.3% | n/a | n/a | n/a | n/a | R | hit | |
| SEN-TN | Solid R | 0.3% | R+25.4 | R+34.8 to R+16.0 | R+12.2 | −13.2 | out | R | hit |
| SEN-TX | Tilt D | 60.2% | D+1.5 | R+6.2 to D+9.1 | D+12.1 | −10.6 | out | D | hit |
| SEN-VA | Solid D | 99.1% | D+23.2 | D+12.3 to D+34.1 | D+23.5 | −0.3 | in | D | hit |
| SEN-WV | Solid R | 0.4% | R+34.5 | R+48.2 to R+20.8 | R+20.3 | −14.2 | out | R | hit |
| SEN-WY | Solid R | 0.5% | R+32.4 | R+45.7 to R+19.1 | R+30.3 | −2.1 | in | R | hit |
| GOV-AK | n/a | 86.7% | D+20.0 | n/a | D+21.4 | −1.5 | D leads | hit | |
| GOV-AL | Solid R | 4.0% | R+12.6 | R+21.3 to R+3.9 | R+3.9 | −8.7 | in | R | hit |
| GOV-AR | Solid R | 1.3% | R+18.4 | R+26.5 to R+10.4 | R+15.3 | −3.1 | in | R | hit |
| GOV-AZ | Lean D | 89.0% | D+7.0 | R+0.1 to D+14.2 | D+13.2 | −6.2 | in | D | hit |
| GOV-CA | Solid D | 99.0% | D+23.8 | D+15.3 to D+32.2 | D+31.2 | −7.4 | in | D | hit |
| GOV-CO | Solid D | 98.4% | D+17.4 | D+8.8 to D+26.1 | D+27.9 | −10.5 | out | D | hit |
| GOV-CT | Solid D | 98.7% | D+17.9 | D+10.6 to D+25.3 | D+19.2 | −1.2 | in | D | hit |
| GOV-FL | Lean R | 14.8% | R+6.8 | R+15.1 to D+1.5 | R+1.3 | −5.5 | in | R | hit |
| GOV-GA | Tilt R | 38.3% | R+2.0 | R+10.3 to D+6.3 | D+8.7 | −10.6 | out | D | miss |
| GOV-HI | Solid D | 99.7% | D+38.1 | D+28.0 to D+48.2 | D+45.3 | −7.2 | in | D | hit |
| GOV-IA | Lean D | 84.8% | D+6.7 | R+1.6 to D+15.0 | D+11.1 | −4.4 | in | D | hit |
| GOV-ID | n/a | 1.1% | R+21.3 | n/a | R+24.7 | +3.4 | R | hit | |
| GOV-IL | Solid D | 98.9% | D+21.0 | D+13.4 to D+28.7 | D+24.6 | −3.6 | in | D | hit |
| GOV-KS | Lean R | 32.0% | R+3.0 | R+11.3 to D+5.3 | D+0.7 | −3.7 | in | D | miss |
| GOV-MA | Solid D | 99.2% | D+25.2 | D+17.9 to D+32.6 | D+27.3 | −2.0 | in | D | hit |
| GOV-MD | Solid D | 99.4% | D+30.0 | D+21.7 to D+38.3 | D+33.7 | −3.7 | in | D | hit |
| GOV-ME | n/a | 93.9% | D+10.1 | n/a | D+16.9 | −6.8 | D | hit | |
| GOV-MI | Lean D | 87.3% | D+7.3 | R+0.9 to D+15.4 | D+10.7 | −3.5 | in | D | hit |
| GOV-MN | Likely D | 92.8% | D+9.5 | D+1.4 to D+17.7 | D+12.9 | −3.3 | in | D | hit |
| GOV-NE | Lean R | 10.3% | R+7.2 | R+14.3 to R+0.1 | R+8.0 | +0.8 | in | R | hit |
| GOV-NH | Likely R | 3.1% | R+11.8 | R+18.9 to R+4.6 | R+4.4 | −7.3 | out | R | hit |
| GOV-NM | Lean D | 84.0% | D+6.6 | R+1.9 to D+15.2 | D+14.7 | −8.1 | in | D | hit |
| GOV-NV | Lean R | 29.8% | R+3.0 | R+10.0 to D+4.1 | D+7.6 | −10.5 | out | D | miss |
| GOV-NY | Likely D | 96.6% | D+11.7 | D+4.4 to D+19.0 | D+19.9 | −8.2 | out | D | hit |
| GOV-OH | Tilt D | 62.4% | D+2.0 | R+6.2 to D+10.1 | D+7.9 | −6.0 | in | D | hit |
| GOV-OK | Likely R | 10.5% | R+8.9 | R+17.9 to D+0.1 | R+6.0 | −2.9 | in | R | hit |
| GOV-OR | Tilt R | 40.9% | R+1.4 | R+8.8 to D+6.1 | D+9.6 | −10.9 | out | D | miss |
| GOV-PA | Solid D | 99.1% | D+23.3 | D+16.1 to D+30.5 | D+22.4 | +1.0 | in | D | hit |
| GOV-RI | n/a | 99.6% | n/a | n/a | n/a | n/a | D | hit | |
| GOV-SC | Solid R | 3.0% | R+13.5 | R+21.8 to R+5.2 | R+4.5 | −9.0 | out | R | hit |
| GOV-SD | Solid R | 1.1% | R+22.2 | R+30.0 to R+14.5 | R+27.0 | +4.7 | in | R | hit |
| GOV-TN | Solid R | 2.0% | R+15.9 | R+24.4 to R+7.4 | R+2.5 | −13.4 | out | R | hit |
| GOV-TX | Lean R | 21.3% | R+4.6 | R+11.8 to D+2.6 | D+7.1 | −11.7 | out | D | miss |
| GOV-VT | Lean R | 22.9% | R+4.2 | R+11.5 to D+3.0 | R+6.6 | +2.4 | in | R | hit |
| GOV-WI | Lean D | 66.9% | D+2.8 | R+5.5 to D+11.1 | D+8.0 | −5.2 | in | D | hit |
| GOV-WY | Solid R | 0.6% | R+28.6 | R+38.9 to R+18.3 | n/a | n/a | R | hit | |
| AK-AL | n/a | 35.2% | n/a | n/a | n/a | n/a | R leads | hit | |
| AL-01 | Solid R | 0.8% | R+25.8 | R+34.4 to R+17.2 | R+18.1 | −7.7 | in | R | hit |
| AL-02 | Tilt R | 32.3% | R+2.3 | R+9.0 to D+4.3 | D+7.5 | −9.8 | out | D | miss |
| AL-03 | Solid R | 0.4% | R+37.7 | R+46.2 to R+29.2 | R+27.9 | −9.9 | out | R | hit |
| AL-04 | Solid R | 0.1% | R+55.6 | R+66.1 to R+45.2 | R+49.7 | −5.9 | in | R | hit |
| AL-05 | Solid R | 1.0% | R+22.7 | R+30.0 to R+15.4 | R+6.5 | −16.2 | out | R | hit |
| AL-06 | Solid R | 0.7% | R+27.7 | R+35.4 to R+20.0 | R+14.9 | −12.8 | out | R | hit |
| AL-07 | Solid D | 99.1% | D+23.8 | D+16.4 to D+31.2 | D+38.8 | −15.0 | out | D | hit |
| AR-01 | Solid R | 0.3% | R+38.3 | R+46.9 to R+29.7 | R+34.4 | −3.8 | in | R | hit |
| AR-02 | Lean R | 22.4% | R+3.9 | R+10.6 to D+2.8 | R+1.7 | −2.2 | in | R | hit |
| AR-03 | Solid R | 1.0% | R+21.8 | R+29.0 to R+14.6 | R+13.4 | −8.5 | out | R | hit |
| AR-04 | Solid R | 0.5% | R+34.0 | R+42.2 to R+25.8 | R+31.0 | −3.0 | in | R | hit |
| AZ-01 | Lean D | 74.7% | D+4.0 | R+3.9 to D+11.8 | D+7.0 | −3.0 | in | D | hit |
| AZ-02 | Lean R | 25.3% | R+3.5 | R+10.3 to D+3.4 | R+1.0 | −2.4 | in | R leads | hit |
| AZ-03 | Solid D | 99.8% | D+46.0 | D+36.6 to D+55.5 | n/a | n/a | D | hit | |
| AZ-04 | Solid D | 98.5% | D+16.7 | D+9.3 to D+24.1 | D+27.2 | −10.5 | out | D | hit |
| AZ-05 | Likely R | 7.8% | R+9.2 | R+17.5 to R+1.0 | R+3.4 | −5.9 | in | R | hit |
| AZ-06 | Tilt D | 65.4% | D+2.2 | R+5.0 to D+9.3 | D+8.1 | −5.9 | in | D | hit |
| AZ-07 | Solid D | 99.4% | D+31.2 | D+23.2 to D+39.2 | D+43.9 | −12.7 | out | D | hit |
| AZ-08 | Likely R | 7.4% | R+8.4 | R+15.8 to R+1.0 | R+2.4 | −6.0 | in | R | hit |
| AZ-09 | Solid R | 1.1% | R+21.7 | R+29.1 to R+14.2 | R+14.9 | −6.7 | in | R | hit |
| CA-01 | Solid D | 98.3% | D+15.0 | D+8.2 to D+21.9 | D+14.2 | +0.8 | in | D | hit |
| CA-02 | Solid D | 99.5% | D+33.9 | D+25.7 to D+42.2 | D+32.3 | +1.6 | in | D | hit |
| CA-03 | Solid D | 98.5% | D+17.9 | D+9.4 to D+26.4 | D+17.5 | +0.4 | in | D | hit |
| CA-04 | n/a | 100.0% | n/a | n/a | n/a | n/a | D leads | not scored | |
| CA-05 | Likely R | 2.8% | R+12.4 | R+19.9 to R+5.0 | R+11.7 | −0.7 | in | R | hit |
| CA-06 | n/a | 100.0% | n/a | n/a | n/a | n/a | D | not scored | |
| CA-07 | n/a | 100.0% | n/a | n/a | n/a | n/a | D | not scored | |
| CA-08 | Solid D | 99.8% | D+42.2 | D+33.1 to D+51.3 | D+46.7 | −4.5 | in | D | hit |
| CA-09 | Solid D | 99.0% | D+22.3 | D+14.8 to D+29.8 | D+33.9 | −11.6 | out | D | hit |
| CA-10 | Solid D | 99.8% | D+41.8 | D+32.8 to D+50.8 | D+39.4 | +2.4 | in | D | hit |
| CA-11 | n/a | 100.0% | n/a | n/a | n/a | n/a | D | not scored | |
| CA-12 | n/a | 100.0% | n/a | n/a | n/a | n/a | D | not scored | |
| CA-13 | Solid D | 97.4% | D+12.7 | D+5.3 to D+20.2 | D+24.4 | −11.7 | out | D | hit |
| CA-14 | n/a | 100.0% | n/a | n/a | n/a | n/a | D | not scored | |
| CA-15 | Solid D | 99.9% | D+54.8 | D+44.4 to D+65.2 | D+59.8 | −5.0 | in | D | hit |
| CA-16 | Solid D | 99.9% | D+55.0 | D+44.6 to D+65.5 | D+55.8 | −0.8 | in | D | hit |
| CA-17 | Solid D | 99.8% | D+46.8 | D+37.2 to D+56.3 | D+45.3 | +1.5 | in | D | hit |
| CA-18 | Solid D | 99.6% | D+37.3 | D+28.7 to D+45.8 | D+46.3 | −9.1 | out | D | hit |
| CA-19 | Solid D | 99.8% | D+42.5 | D+33.4 to D+51.6 | D+44.6 | −2.1 | in | D | hit |
| CA-20 | Solid R | 1.0% | R+22.5 | R+30.0 to R+15.1 | R+22.6 | +0.1 | in | R | hit |
| CA-21 | Solid D | 98.5% | D+17.5 | D+10.1 to D+25.0 | D+28.1 | −10.6 | out | D | hit |
| CA-22 | Lean D | 89.7% | D+6.9 | R+0.1 to D+13.9 | D+35.8 | −28.9 | out | D | hit |
| CA-23 | Likely R | 3.5% | R+11.3 | R+18.8 to R+3.9 | R+1.6 | −9.7 | out | R leads | hit |
| CA-24 | Solid D | 99.5% | D+34.2 | D+25.9 to D+42.5 | D+32.9 | +1.2 | in | D | hit |
| CA-25 | Solid D | 98.6% | D+17.4 | D+9.9 to D+24.8 | D+31.6 | −14.2 | out | D | hit |
| CA-26 | Solid D | 98.9% | D+22.4 | D+13.8 to D+30.9 | D+25.8 | −3.5 | in | D | hit |
| CA-27 | Solid D | 98.9% | D+20.8 | D+13.4 to D+28.3 | D+28.3 | −7.4 | in | D | hit |
| CA-28 | Solid D | 99.5% | D+34.5 | D+26.2 to D+42.8 | D+39.1 | −4.6 | in | D | hit |
| CA-29 | n/a | 100.0% | n/a | n/a | n/a | n/a | D | not scored | |
| CA-30 | Solid D | 99.9% | D+47.6 | D+37.9 to D+57.2 | D+55.1 | −7.6 | in | D | hit |
| CA-31 | Solid D | 99.0% | D+23.0 | D+15.5 to D+30.5 | D+32.6 | −9.6 | out | D | hit |
| CA-32 | Solid D | 99.5% | D+34.2 | D+25.9 to D+42.5 | D+34.5 | −0.3 | in | D | hit |
| CA-33 | Solid D | 98.8% | D+20.9 | D+13.4 to D+28.4 | D+37.9 | −17.0 | out | D | hit |
| CA-34 | n/a | 100.0% | n/a | n/a | n/a | n/a | D | not scored | |
| CA-35 | Solid D | 98.7% | D+19.1 | D+11.6 to D+26.6 | D+34.0 | −14.9 | out | D | hit |
| CA-36 | Solid D | 99.8% | D+46.7 | D+37.2 to D+56.2 | D+45.9 | +0.8 | in | D | hit |
| CA-37 | n/a | 100.0% | n/a | n/a | n/a | n/a | D | not scored | |
| CA-38 | Solid D | 98.7% | D+19.8 | D+11.3 to D+28.4 | D+34.8 | −14.9 | out | D | hit |
| CA-39 | Solid D | 98.9% | D+20.7 | D+13.2 to D+28.1 | D+36.5 | −15.8 | out | D | hit |
| CA-40 | n/a | 0.0% | n/a | n/a | n/a | n/a | R leads | not scored | |
| CA-41 | Solid D | 98.9% | D+21.4 | D+12.9 to D+29.9 | D+35.0 | −13.7 | out | D | hit |
| CA-42 | Solid D | 99.1% | D+23.8 | D+16.3 to D+31.3 | D+23.8 | +0.1 | in | D | hit |
| CA-43 | Solid D | 99.9% | D+55.7 | D+45.2 to D+66.3 | D+65.8 | −10.1 | in | D | hit |
| CA-44 | Solid D | 99.8% | D+43.2 | D+34.0 to D+52.3 | D+63.4 | −20.3 | out | D | hit |
| CA-45 | Solid D | 98.2% | D+15.8 | D+8.3 to D+23.2 | D+21.9 | −6.2 | in | D | hit |
| CA-46 | Solid D | 99.2% | D+26.5 | D+18.9 to D+34.1 | D+43.0 | −16.5 | out | D | hit |
| CA-47 | Solid D | 98.9% | D+21.2 | D+13.7 to D+28.6 | D+17.1 | +4.1 | in | D | hit |
| CA-48 | Lean D | 84.9% | D+5.9 | R+1.5 to D+13.3 | D+19.5 | −13.6 | out | D | hit |
| CA-49 | Solid D | 98.9% | D+22.9 | D+15.4 to D+30.4 | D+18.3 | +4.6 | in | D | hit |
| CA-50 | Solid D | 99.3% | D+28.3 | D+20.5 to D+36.1 | D+26.8 | +1.5 | in | D | hit |
| CA-51 | Solid D | 99.3% | D+28.3 | D+20.5 to D+36.0 | D+31.8 | −3.6 | in | D | hit |
| CA-52 | Solid D | 99.2% | D+27.7 | D+20.0 to D+35.4 | D+43.1 | −15.4 | out | D | hit |
| CO-01 | Solid D | 100.0% | D+57.1 | D+45.0 to D+69.2 | D+64.2 | −7.1 | in | D | hit |
| CO-02 | Solid D | 99.9% | D+46.6 | D+37.2 to D+56.0 | D+51.3 | −4.7 | in | D | hit |
| CO-03 | Tilt R | 42.1% | R+1.0 | R+7.8 to D+5.8 | R+1.8 | +0.8 | in | R | hit |
| CO-04 | Lean R | 16.4% | R+5.2 | R+12.1 to D+1.7 | D+0.9 | −6.1 | in | D leads | miss |
| CO-05 | Tilt R | 44.6% | R+0.6 | R+7.2 to D+5.9 | D+4.7 | −5.4 | in | D | miss |
| CO-06 | Solid D | 99.5% | D+30.4 | D+22.6 to D+38.2 | D+34.6 | −4.2 | in | D | hit |
| CO-07 | Solid D | 99.2% | D+25.8 | D+18.4 to D+33.2 | D+24.6 | +1.2 | in | D | hit |
| CO-08 | Lean D | 71.2% | D+2.9 | R+4.0 to D+9.9 | D+14.7 | −11.8 | out | D | hit |
| CT-01 | Solid D | 99.4% | D+32.0 | D+22.8 to D+41.1 | D+36.3 | −4.3 | in | D | hit |
| CT-02 | Solid D | 98.9% | D+21.8 | D+14.6 to D+28.9 | D+24.9 | −3.1 | in | D | hit |
| CT-03 | Solid D | 99.2% | D+27.3 | D+19.7 to D+34.9 | D+25.6 | +1.6 | in | D | hit |
| CT-04 | Solid D | 99.6% | D+34.0 | D+25.8 to D+42.3 | D+33.1 | +1.0 | in | D | hit |
| CT-05 | Solid D | 98.2% | D+14.6 | D+7.4 to D+21.7 | D+15.7 | −1.1 | in | D | hit |
| DE-AL | Solid D | 99.1% | D+24.5 | D+17.1 to D+31.9 | D+28.7 | −4.2 | in | D | hit |
| FL-01 | Solid R | 0.7% | R+28.9 | R+36.7 to R+21.1 | R+26.9 | −2.1 | in | R | hit |
| FL-02 | Likely R | 8.6% | R+9.1 | R+17.6 to R+0.6 | R+4.2 | −4.9 | in | R | hit |
| FL-03 | Solid R | 1.9% | R+14.9 | R+22.3 to R+7.5 | R+12.1 | −2.7 | in | R | hit |
| FL-04 | Lean R | 11.3% | R+7.0 | R+14.4 to D+0.4 | R+2.1 | −4.9 | in | R | hit |
| FL-05 | Solid R | 1.7% | R+15.3 | R+22.7 to R+7.9 | R+12.8 | −2.5 | in | R | hit |
| FL-06 | Solid R | 1.1% | R+22.8 | R+30.2 to R+15.3 | R+19.0 | −3.8 | in | R | hit |
| FL-07 | Lean R | 32.7% | R+2.7 | R+10.8 to D+5.3 | R+0.5 | −2.2 | in | R | hit |
| FL-08 | Likely R | 4.7% | R+9.8 | R+16.9 to R+2.6 | R+6.3 | −3.4 | in | R | hit |
| FL-09 | Lean R | 28.1% | R+3.1 | R+10.1 to D+3.9 | D+0.5 | −3.6 | in | D | miss |
| FL-10 | Solid D | 100.0% | n/a | n/a | n/a | n/a | D leads | not scored | |
| FL-11 | Lean R | 22.9% | R+4.6 | R+12.7 to D+3.6 | R+6.9 | +2.3 | in | R | hit |
| FL-12 | Likely R | 4.8% | R+10.1 | R+17.5 to R+2.6 | R+6.8 | −3.3 | in | R | hit |
| FL-13 | Lean R | 23.3% | R+3.7 | R+10.2 to D+2.9 | R+0.8 | −2.9 | in | R | hit |
| FL-14 | Lean D | 81.3% | D+4.8 | R+2.2 to D+11.7 | D+5.4 | −0.6 | in | D | hit |
| FL-15 | Solid R | 2.1% | R+13.9 | R+21.4 to R+6.5 | R+8.6 | −5.4 | in | R | hit |
| FL-16 | Lean R | 23.1% | R+4.4 | R+12.4 to D+3.5 | R+4.2 | −0.2 | in | R | hit |
| FL-17 | Solid R | 1.6% | R+15.8 | R+23.2 to R+8.4 | R+18.3 | +2.5 | in | R | hit |
| FL-18 | Likely R | 3.5% | R+11.4 | R+18.8 to R+4.0 | R+3.6 | −7.8 | out | R | hit |
| FL-19 | Solid R | 1.3% | R+19.5 | R+28.0 to R+11.0 | R+23.5 | +3.9 | in | R | hit |
| FL-20 | Solid D | 99.7% | D+38.8 | D+28.8 to D+48.8 | D+52.6 | −13.8 | out | D | hit |
| FL-21 | Likely R | 2.8% | R+11.9 | R+19.0 to R+4.7 | R+9.1 | −2.8 | in | R | hit |
| FL-22 | Tilt R | 45.6% | R+0.7 | R+8.7 to D+7.3 | D+3.8 | −4.5 | in | D | miss |
| FL-23 | Solid D | 98.5% | D+18.5 | D+10.0 to D+26.9 | D+31.3 | −12.8 | out | D | hit |
| FL-24 | Solid D | 99.7% | D+40.2 | D+30.1 to D+50.3 | D+61.2 | −21.0 | out | D | hit |
| FL-25 | Tilt D | 51.2% | D+0.2 | R+7.5 to D+8.0 | D+4.6 | −4.4 | in | D | hit |
| FL-26 | Solid R | 2.7% | R+12.6 | R+20.0 to R+5.2 | R+0.7 | −11.9 | out | R | hit |
| FL-27 | Lean R | 18.7% | R+4.7 | R+11.7 to D+2.2 | R+0.4 | −4.3 | in | R leads | hit |
| FL-28 | Solid R | 1.3% | R+18.8 | R+26.2 to R+11.3 | R+7.2 | −11.5 | out | R | hit |
| GA-01 | Likely R | 9.6% | R+8.6 | R+17.1 to R+0.1 | R+2.8 | −5.8 | in | R | hit |
| GA-02 | Solid D | 98.7% | D+19.1 | D+11.7 to D+26.6 | D+21.6 | −2.5 | in | D | hit |
| GA-03 | Solid R | 1.6% | R+15.9 | R+23.1 to R+8.7 | R+17.2 | +1.3 | in | R | hit |
| GA-04 | Solid D | 99.9% | D+55.0 | D+44.5 to D+65.4 | D+65.3 | −10.3 | in | D | hit |
| GA-05 | Solid D | 100.0% | D+72.1 | D+59.5 to D+84.7 | D+80.4 | −8.3 | in | D | hit |
| GA-06 | Solid D | 99.9% | D+52.7 | D+42.6 to D+62.9 | D+61.8 | −9.0 | in | D | hit |
| GA-07 | Likely R | 5.2% | R+9.4 | R+16.5 to R+2.3 | R+12.4 | +3.0 | in | R | hit |
| GA-08 | Solid R | 1.0% | R+24.0 | R+31.5 to R+16.5 | R+20.8 | −3.2 | in | R | hit |
| GA-09 | Solid R | 0.8% | R+25.8 | R+33.3 to R+18.2 | R+18.6 | −7.2 | in | R | hit |
| GA-10 | Likely R | 4.4% | R+11.8 | R+20.3 to R+3.3 | R+7.3 | −4.5 | in | R | hit |
| GA-11 | Likely R | 7.1% | R+9.5 | R+17.7 to R+1.3 | R+10.7 | +1.2 | in | R | hit |
| GA-12 | Likely R | 5.0% | R+9.9 | R+17.4 to R+2.5 | R+4.2 | −5.8 | in | R | hit |
| GA-13 | Solid D | 99.8% | D+43.8 | D+33.3 to D+54.3 | D+59.7 | −15.9 | out | D | hit |
| GA-14 | Solid R | 1.0% | R+23.8 | R+31.3 to R+16.3 | R+17.5 | −6.2 | in | R | hit |
| HI-01 | Solid D | 99.7% | D+38.2 | D+29.9 to D+46.6 | D+48.9 | −10.6 | out | D | hit |
| HI-02 | Solid D | 99.6% | D+33.9 | D+26.0 to D+41.7 | D+33.0 | +0.8 | in | D | hit |
| IA-01 | Likely D | 93.6% | D+8.6 | D+1.6 to D+15.5 | D+9.6 | −1.0 | in | D | hit |
| IA-02 | Tilt D | 52.1% | D+0.3 | R+7.5 to D+8.1 | D+4.0 | −3.7 | in | D | hit |
| IA-03 | Tilt R | 45.2% | R+0.6 | R+7.9 to D+6.6 | D+7.3 | −7.9 | out | D | miss |
| IA-04 | Solid R | 1.2% | R+20.2 | R+28.5 to R+11.8 | R+18.1 | −2.1 | in | R | hit |
| ID-01 | Solid R | 0.7% | R+27.2 | R+34.0 to R+20.4 | R+35.3 | +8.1 | out | R | hit |
| ID-02 | Solid R | 1.3% | R+17.3 | R+24.0 to R+10.7 | R+11.4 | −5.9 | in | R | hit |
| IL-01 | Solid D | 99.7% | D+39.4 | D+30.6 to D+48.2 | D+44.8 | −5.4 | in | D | hit |
| IL-02 | Solid D | 99.6% | D+37.8 | D+27.9 to D+47.6 | D+47.1 | −9.3 | in | D | hit |
| IL-03 | Solid D | 99.7% | D+40.1 | D+31.2 to D+49.0 | D+54.8 | −14.7 | out | D | hit |
| IL-04 | Solid D | 99.5% | D+32.6 | D+23.7 to D+41.4 | D+55.3 | −22.7 | out | D | hit |
| IL-05 | Solid D | 99.8% | D+43.8 | D+34.6 to D+53.0 | D+54.2 | −10.4 | out | D | hit |
| IL-06 | Solid D | 98.6% | D+18.2 | D+10.8 to D+25.7 | D+25.8 | −7.6 | out | D | hit |
| IL-07 | Solid D | 100.0% | D+65.5 | D+52.1 to D+78.8 | D+78.6 | −13.1 | in | D | hit |
| IL-08 | Solid D | 98.4% | D+17.6 | D+9.1 to D+26.1 | D+28.7 | −11.0 | out | D | hit |
| IL-09 | Solid D | 99.7% | D+40.1 | D+30.0 to D+50.2 | D+53.7 | −13.6 | out | D | hit |
| IL-10 | Solid D | 99.4% | D+30.4 | D+22.4 to D+38.3 | D+40.7 | −10.3 | out | D | hit |
| IL-11 | Solid D | 99.0% | D+22.1 | D+14.6 to D+29.6 | D+28.6 | −6.5 | in | D | hit |
| IL-12 | Solid R | 0.5% | R+32.6 | R+40.7 to R+24.5 | R+39.0 | +6.4 | in | R | hit |
| IL-13 | Solid D | 99.0% | D+23.4 | D+15.9 to D+30.9 | D+25.4 | −2.0 | in | D | hit |
| IL-14 | Solid D | 98.7% | D+18.7 | D+11.3 to D+26.2 | D+25.1 | −6.4 | in | D | hit |
| IL-15 | Solid R | 0.7% | R+29.0 | R+36.8 to R+21.2 | R+33.8 | +4.8 | in | R | hit |
| IL-16 | Solid R | 2.0% | R+14.0 | R+21.5 to R+6.6 | R+17.6 | +3.5 | in | R | hit |
| IL-17 | Solid D | 98.7% | D+18.0 | D+10.6 to D+25.5 | D+20.3 | −2.3 | in | D | hit |
| IN-01 | Solid D | 97.4% | D+12.5 | D+5.1 to D+19.8 | D+25.8 | −13.3 | out | D | hit |
| IN-02 | Solid R | 1.2% | R+19.9 | R+27.1 to R+12.6 | R+5.0 | −14.9 | out | R | hit |
| IN-03 | Solid R | 0.9% | R+23.9 | R+31.1 to R+16.7 | R+9.7 | −14.1 | out | R | hit |
| IN-04 | Solid R | 0.9% | R+23.6 | R+30.9 to R+16.3 | R+8.5 | −15.1 | out | R | hit |
| IN-05 | Lean R | 15.7% | R+5.1 | R+11.7 to D+1.5 | D+3.3 | −8.4 | out | D | miss |
| IN-06 | Solid R | 0.9% | R+24.5 | R+31.8 to R+17.2 | R+10.2 | −14.3 | out | R | hit |
| IN-07 | Solid D | 99.8% | D+42.8 | D+33.8 to D+51.8 | D+56.6 | −13.8 | out | D | hit |
| IN-08 | Solid R | 0.7% | R+28.0 | R+35.6 to R+20.4 | R+10.5 | −17.5 | out | R | hit |
| IN-09 | Solid R | 1.0% | R+22.7 | R+30.0 to R+15.4 | R+10.6 | −12.1 | out | R | hit |
| KS-01 | Solid R | 1.0% | R+24.3 | R+31.7 to R+16.8 | R+21.6 | −2.7 | in | R | hit |
| KS-02 | Likely R | 8.0% | R+7.6 | R+14.5 to R+0.7 | R+6.2 | −1.4 | in | R | hit |
| KS-03 | Solid D | 98.4% | D+16.6 | D+9.3 to D+23.8 | D+21.2 | −4.6 | in | D | hit |
| KS-04 | Solid R | 1.4% | R+17.5 | R+25.0 to R+10.1 | R+9.5 | −8.1 | out | R | hit |
| KY-01 | Solid R | 0.3% | R+38.9 | R+47.7 to R+30.2 | R+35.1 | −3.8 | in | R | hit |
| KY-02 | Solid R | 0.4% | R+34.8 | R+43.1 to R+26.5 | R+27.7 | −7.1 | in | R | hit |
| KY-03 | Solid D | 99.2% | D+26.2 | D+18.6 to D+33.7 | D+40.7 | −14.5 | out | D | hit |
| KY-04 | Solid R | 0.8% | R+25.3 | R+33.7 to R+16.9 | R+13.4 | −11.9 | out | R | hit |
| KY-05 | Solid R | 0.1% | R+54.8 | R+65.2 to R+44.3 | R+45.8 | −9.0 | in | R | hit |
| KY-06 | Tilt D | 56.5% | D+0.9 | R+6.4 to D+8.2 | D+9.4 | −8.5 | out | D | hit |
| LA-01 | Solid R | 0.6% | R+31.2 | R+39.2 to R+23.3 | R+26.7 | −4.5 | in | R | hit |
| LA-02 | Solid D | 99.9% | D+50.4 | D+40.5 to D+60.3 | D+64.8 | −14.4 | out | D | hit |
| LA-03 | Solid R | 0.7% | R+29.4 | R+37.2 to R+21.6 | R+34.1 | +4.7 | in | R | hit |
| LA-04 | Solid R | 0.7% | R+27.7 | R+35.4 to R+20.1 | R+35.5 | +7.8 | out | R | hit |
| LA-05 | Solid R | 0.9% | R+24.4 | R+33.0 to R+15.9 | n/a | n/a | runoff Dec 12 | pending | |
| LA-06 | Solid R | 1.1% | R+22.6 | R+31.1 to R+14.1 | n/a | n/a | runoff Dec 12 | pending | |
| MA-01 | Solid D | 100.0% | n/a | n/a | n/a | n/a | D | not scored | |
| MA-02 | Solid D | 100.0% | n/a | n/a | n/a | n/a | D leads | not scored | |
| MA-03 | Solid D | 99.5% | D+30.9 | D+23.1 to D+38.7 | D+36.9 | −6.0 | in | D | hit |
| MA-04 | Solid D | 99.5% | D+31.4 | D+23.5 to D+39.2 | D+32.8 | −1.4 | in | D | hit |
| MA-05 | Solid D | 100.0% | n/a | n/a | n/a | n/a | D leads | not scored | |
| MA-06 | Solid D | 99.3% | D+28.9 | D+20.2 to D+37.5 | D+26.8 | +2.1 | in | D | hit |
| MA-07 | Solid D | 100.0% | n/a | n/a | n/a | n/a | D leads | not scored | |
| MA-08 | Solid D | 99.8% | D+41.1 | D+32.4 to D+49.8 | D+42.6 | −1.5 | in | D | hit |
| MA-09 | Solid D | 99.1% | D+24.6 | D+17.3 to D+31.9 | D+21.7 | +2.9 | in | D | hit |
| MD-01 | Likely R | 3.4% | R+10.8 | R+17.8 to R+3.7 | R+4.9 | −5.8 | in | R | hit |
| MD-02 | Solid D | 99.4% | D+29.7 | D+21.9 to D+37.5 | D+29.9 | −0.2 | in | D | hit |
| MD-03 | Solid D | 99.5% | D+33.2 | D+25.1 to D+41.3 | D+35.8 | −2.6 | in | D | hit |
| MD-04 | Solid D | 100.0% | D+78.5 | D+64.9 to D+92.0 | D+83.2 | −4.8 | in | D | hit |
| MD-05 | Solid D | 99.7% | D+39.7 | D+29.7 to D+49.8 | D+41.4 | −1.7 | in | D | hit |
| MD-06 | Solid D | 98.8% | D+19.3 | D+11.9 to D+26.7 | D+20.4 | −1.0 | in | D | hit |
| MD-07 | Solid D | 100.0% | D+65.9 | D+54.1 to D+77.6 | D+69.7 | −3.8 | in | D | hit |
| MD-08 | Solid D | 100.0% | D+61.6 | D+50.5 to D+72.8 | D+68.2 | −6.6 | in | D | hit |
| ME-01 | Solid D | 99.3% | D+28.8 | D+21.7 to D+35.9 | D+32.2 | −3.4 | in | D | hit |
| ME-02 | Tilt R | 45.2% | R+0.7 | R+8.0 to D+6.6 | R+1.6 | +1.0 | in | R | hit |
| MI-01 | Solid R | 2.2% | R+13.7 | R+20.9 to R+6.4 | R+9.5 | −4.1 | in | R | hit |
| MI-02 | Solid R | 1.0% | R+22.3 | R+29.5 to R+15.0 | R+24.5 | +2.2 | in | R | hit |
| MI-03 | Solid D | 98.7% | D+17.6 | D+10.3 to D+24.8 | D+15.7 | +1.9 | in | D | hit |
| MI-04 | Lean R | 25.8% | R+3.3 | R+9.9 to D+3.3 | D+1.8 | −5.1 | in | D | miss |
| MI-05 | Solid R | 1.2% | R+20.5 | R+27.8 to R+13.2 | R+20.6 | +0.1 | in | R | hit |
| MI-06 | Solid D | 99.5% | D+31.3 | D+23.4 to D+39.3 | D+37.0 | −5.7 | in | D | hit |
| MI-07 | Lean D | 74.5% | D+3.4 | R+3.3 to D+10.1 | D+3.3 | +0.1 | in | D | hit |
| MI-08 | Likely D | 97.0% | D+11.7 | D+4.6 to D+18.9 | D+13.6 | −1.9 | in | D | hit |
| MI-09 | Solid R | 0.9% | R+24.6 | R+31.9 to R+17.3 | R+27.9 | +3.3 | in | R | hit |
| MI-10 | Lean R | 23.2% | R+4.2 | R+11.8 to D+3.3 | D+7.2 | −11.4 | out | D | miss |
| MI-11 | Solid D | 98.9% | D+21.6 | D+13.2 to D+30.0 | D+24.0 | −2.4 | in | D | hit |
| MI-12 | Solid D | 99.8% | D+44.2 | D+35.1 to D+53.3 | D+54.7 | −10.5 | out | D | hit |
| MI-13 | Solid D | 99.8% | D+43.2 | D+33.4 to D+52.9 | D+56.5 | −13.3 | out | D | hit |
| MN-01 | Tilt R | 38.8% | R+1.4 | R+8.0 to D+5.1 | D+0.1 | −1.5 | in | D leads | miss |
| MN-02 | Solid D | 97.0% | D+12.6 | D+4.7 to D+20.6 | D+14.3 | −1.6 | in | D | hit |
| MN-03 | Solid D | 99.3% | D+28.7 | D+20.9 to D+36.5 | D+28.2 | +0.5 | in | D | hit |
| MN-04 | Solid D | 99.7% | D+41.9 | D+32.9 to D+50.9 | D+46.3 | −4.4 | in | D | hit |
| MN-05 | Solid D | 100.0% | D+60.0 | D+49.0 to D+71.0 | D+60.3 | −0.3 | in | D | hit |
| MN-06 | Solid R | 2.5% | R+12.7 | R+20.1 to R+5.2 | R+11.6 | −1.1 | in | R | hit |
| MN-07 | Solid R | 0.8% | R+25.9 | R+33.4 to R+18.5 | R+29.9 | +3.9 | in | R | hit |
| MN-08 | Likely R | 8.3% | R+7.6 | R+14.6 to R+0.6 | R+6.2 | −1.4 | in | R | hit |
| MO-01 | Solid D | 99.9% | D+57.9 | D+47.2 to D+68.5 | D+67.5 | −9.7 | in | D | hit |
| MO-02 | Tilt R | 44.5% | R+0.7 | R+7.1 to D+5.8 | D+4.9 | −5.6 | in | D | miss |
| MO-03 | Solid R | 1.3% | R+18.8 | R+26.1 to R+11.5 | R+8.5 | −10.3 | out | R | hit |
| MO-04 | Solid R | 0.5% | R+32.8 | R+40.8 to R+24.7 | R+25.9 | −6.8 | in | R | hit |
| MO-05 | Solid D | 99.4% | D+29.2 | D+21.5 to D+36.9 | D+41.4 | −12.2 | out | D | hit |
| MO-06 | Solid R | 0.7% | R+27.6 | R+36.2 to R+18.9 | R+19.7 | −7.8 | in | R | hit |
| MO-07 | Solid R | 0.5% | R+33.2 | R+41.2 to R+25.1 | R+26.8 | −6.4 | in | R | hit |
| MO-08 | Solid R | 0.2% | R+42.1 | R+51.1 to R+33.2 | R+38.6 | −3.6 | in | R | hit |
| MS-01 | Solid R | 0.6% | R+30.4 | R+38.4 to R+22.5 | R+17.3 | −13.1 | out | R | hit |
| MS-02 | Solid D | 99.2% | D+26.7 | D+19.0 to D+34.3 | D+38.1 | −11.5 | out | D | hit |
| MS-03 | Solid R | 0.9% | R+24.0 | R+31.4 to R+16.5 | R+15.9 | −8.0 | out | R | hit |
| MS-04 | Solid R | 0.5% | R+36.0 | R+44.4 to R+27.6 | R+24.7 | −11.3 | out | R | hit |
| MT-01 | Tilt D | 59.5% | D+1.3 | R+5.7 to D+8.3 | D+3.9 | −2.6 | in | D | hit |
| MT-02 | Solid R | 1.4% | R+17.9 | R+24.9 to R+11.0 | R+25.8 | +7.9 | out | R | hit |
| NC-01 | Lean D | 72.8% | D+3.0 | R+3.4 to D+9.4 | D+3.4 | −0.4 | in | D | hit |
| NC-02 | Solid D | 99.7% | D+39.4 | D+30.7 to D+48.1 | D+51.6 | −12.2 | out | D | hit |
| NC-03 | Lean R | 12.2% | R+6.5 | R+13.7 to D+0.7 | D+0.1 | −6.6 | in | D leads | miss |
| NC-04 | Solid D | 99.9% | D+49.2 | D+39.4 to D+58.9 | D+60.2 | −11.0 | out | D | hit |
| NC-05 | Likely R | 3.7% | R+11.0 | R+18.4 to R+3.5 | D+0.1 | −11.1 | out | D leads | miss |
| NC-06 | Likely R | 4.0% | R+10.7 | R+18.0 to R+3.3 | D+2.4 | −13.1 | out | D | miss |
| NC-07 | Likely R | 7.3% | R+8.3 | R+15.5 to R+1.1 | R+0.7 | −7.6 | out | R leads | hit |
| NC-08 | Likely R | 3.0% | R+11.9 | R+19.3 to R+4.5 | R+1.7 | −10.2 | out | R | hit |
| NC-09 | Lean R | 9.0% | R+7.1 | R+13.9 to R+0.4 | D+2.3 | −9.4 | out | D | miss |
| NC-10 | Likely R | 3.2% | R+11.3 | R+18.6 to R+4.1 | R+0.8 | −10.5 | out | R leads | hit |
| NC-11 | Lean D | 80.2% | D+5.0 | R+2.6 to D+12.5 | D+15.8 | −10.9 | out | D | hit |
| NC-12 | Solid D | 99.9% | D+50.5 | D+40.6 to D+60.5 | D+62.5 | −11.9 | out | D | hit |
| NC-13 | Likely R | 5.1% | R+9.8 | R+17.2 to R+2.4 | D+2.5 | −12.3 | out | D | miss |
| NC-14 | Likely R | 7.6% | R+8.4 | R+15.8 to R+1.0 | D+2.3 | −10.7 | out | D | miss |
| ND-AL | Solid R | 0.6% | R+27.5 | R+34.9 to R+20.0 | R+20.7 | −6.8 | in | R | hit |
| NE-01 | Lean R | 21.0% | R+4.2 | R+11.0 to D+2.6 | R+3.5 | −0.7 | in | R | hit |
| NE-02 | Likely D | 93.9% | D+9.9 | D+1.9 to D+17.9 | D+15.9 | −6.0 | in | D | hit |
| NE-03 | Solid R | 0.2% | R+43.3 | R+52.4 to R+34.3 | R+51.1 | +7.8 | in | R | hit |
| NH-01 | Likely D | 92.3% | D+8.5 | D+1.0 to D+16.0 | D+14.1 | −5.6 | in | D | hit |
| NH-02 | Solid D | 98.6% | D+16.3 | D+9.7 to D+22.8 | D+20.0 | −3.7 | in | D | hit |
| NJ-01 | Solid D | 99.4% | D+28.5 | D+20.8 to D+36.1 | D+40.7 | −12.3 | out | D | hit |
| NJ-02 | Likely R | 4.6% | R+9.6 | R+16.6 to R+2.7 | D+2.7 | −12.4 | out | D | miss |
| NJ-03 | Solid D | 98.9% | D+20.4 | D+13.0 to D+27.7 | D+27.5 | −7.1 | in | D | hit |
| NJ-04 | Solid R | 1.2% | R+20.3 | R+27.7 to R+13.0 | R+18.0 | −2.4 | in | R | hit |
| NJ-05 | Solid D | 98.7% | D+18.0 | D+10.7 to D+25.4 | D+27.9 | −9.9 | out | D | hit |
| NJ-06 | Solid D | 99.0% | D+21.9 | D+14.6 to D+29.2 | D+38.7 | −16.8 | out | D | hit |
| NJ-07 | Lean D | 78.7% | D+4.3 | R+2.7 to D+11.3 | D+16.5 | −12.2 | out | D | hit |
| NJ-08 | Solid D | 100.0% | n/a | n/a | n/a | n/a | D | not scored | |
| NJ-09 | Solid D | 98.2% | D+14.4 | D+7.2 to D+21.7 | D+34.9 | −20.5 | out | D | hit |
| NJ-10 | Solid D | 99.9% | D+56.3 | D+45.8 to D+66.8 | D+69.2 | −13.0 | out | D | hit |
| NJ-11 | Solid D | 99.0% | D+22.8 | D+15.4 to D+30.1 | D+22.5 | +0.3 | in | D | hit |
| NJ-12 | Solid D | 99.4% | D+30.2 | D+21.3 to D+39.2 | D+42.6 | −12.4 | out | D | hit |
| NM-01 | Solid D | 98.9% | D+21.5 | D+14.0 to D+28.9 | D+27.3 | −5.8 | in | D | hit |
| NM-02 | Lean D | 86.6% | D+6.0 | R+0.9 to D+12.9 | D+17.5 | −11.5 | out | D | hit |
| NM-03 | Solid D | 98.4% | D+16.1 | D+8.9 to D+23.2 | D+23.3 | −7.2 | out | D | hit |
| NV-01 | Solid D | 97.8% | D+13.3 | D+6.1 to D+20.6 | D+21.5 | −8.2 | out | D | hit |
| NV-02 | Lean R | 26.5% | R+3.7 | R+11.6 to D+4.1 | D+5.8 | −9.6 | out | D | miss |
| NV-03 | Lean D | 89.6% | D+6.9 | R+0.1 to D+13.9 | D+21.5 | −14.6 | out | D | hit |
| NV-04 | Solid D | 97.9% | D+13.7 | D+6.4 to D+21.0 | D+22.7 | −9.0 | out | D | hit |
| NY-01 | Tilt R | 34.1% | R+2.3 | R+9.6 to D+5.1 | R+2.2 | −0.0 | in | R | hit |
| NY-02 | Lean R | 9.8% | R+7.4 | R+14.8 to D+0.0 | R+2.3 | −5.1 | in | R | hit |
| NY-03 | Likely D | 97.1% | D+12.1 | D+4.7 to D+19.5 | D+10.3 | +1.8 | in | D | hit |
| NY-04 | Solid D | 98.1% | D+14.4 | D+6.9 to D+21.8 | D+13.4 | +0.9 | in | D | hit |
| NY-05 | Solid D | 99.9% | D+49.3 | D+39.5 to D+59.0 | D+61.2 | −12.0 | out | D | hit |
| NY-06 | Solid D | 99.1% | D+24.2 | D+16.8 to D+31.6 | D+38.0 | −13.8 | out | D | hit |
| NY-07 | Solid D | 99.9% | D+52.3 | D+40.7 to D+63.9 | D+68.3 | −16.0 | out | D | hit |
| NY-08 | Solid D | 99.9% | D+52.5 | D+42.4 to D+62.7 | D+59.3 | −6.7 | in | D | hit |
| NY-09 | Solid D | 99.9% | D+49.8 | D+39.9 to D+59.6 | D+65.1 | −15.3 | out | D | hit |
| NY-10 | Solid D | 100.0% | D+63.0 | D+50.1 to D+76.0 | D+67.3 | −4.3 | in | D | hit |
| NY-11 | Solid R | 1.7% | R+15.5 | R+22.9 to R+8.1 | R+12.3 | −3.2 | in | R | hit |
| NY-12 | Solid D | 100.0% | D+62.6 | D+49.7 to D+75.6 | D+57.2 | +5.5 | in | D | hit |
| NY-13 | Solid D | 100.0% | D+62.8 | D+49.8 to D+75.8 | D+76.2 | −13.4 | out | D | hit |
| NY-14 | Solid D | 99.7% | D+41.6 | D+32.6 to D+50.5 | D+56.7 | −15.1 | out | D | hit |
| NY-15 | Solid D | 100.0% | D+56.4 | D+45.8 to D+67.0 | D+66.1 | −9.7 | in | D | hit |
| NY-16 | Solid D | 99.8% | D+44.3 | D+35.0 to D+53.6 | D+51.8 | −7.5 | in | D | hit |
| NY-17 | Tilt D | 52.2% | D+0.3 | R+6.2 to D+6.8 | D+6.0 | −5.7 | in | D | hit |
| NY-18 | Solid D | 98.4% | D+16.5 | D+9.5 to D+23.5 | D+25.8 | −9.3 | out | D | hit |
| NY-19 | Solid D | 98.1% | D+14.6 | D+7.1 to D+22.0 | D+14.7 | −0.1 | in | D | hit |
| NY-20 | Solid D | 99.2% | D+27.7 | D+20.0 to D+35.4 | D+27.4 | +0.2 | in | D | hit |
| NY-21 | Lean R | 26.1% | R+3.6 | R+11.1 to D+3.8 | R+1.8 | −1.9 | in | R | hit |
| NY-22 | Solid D | 98.8% | D+19.9 | D+12.4 to D+27.3 | D+17.0 | +2.9 | in | D | hit |
| NY-23 | Solid R | 1.4% | R+17.6 | R+24.6 to R+10.6 | R+20.4 | +2.8 | in | R | hit |
| NY-24 | Solid R | 1.6% | R+16.0 | R+23.4 to R+8.6 | R+20.7 | +4.7 | in | R | hit |
| NY-25 | Solid D | 99.3% | D+29.5 | D+21.7 to D+37.4 | D+26.0 | +3.5 | in | D | hit |
| NY-26 | Solid D | 99.5% | D+33.1 | D+24.9 to D+41.2 | D+32.0 | +1.0 | in | D | hit |
| OH-01 | Lean D | 85.3% | D+5.4 | R+1.2 to D+12.0 | D+11.4 | −6.0 | in | D | hit |
| OH-02 | Solid R | 0.5% | R+33.6 | R+41.8 to R+25.4 | R+28.5 | −5.1 | in | R | hit |
| OH-03 | Solid D | 99.8% | D+44.8 | D+35.5 to D+54.1 | D+54.4 | −9.6 | out | D | hit |
| OH-04 | Solid R | 0.5% | R+34.0 | R+42.3 to R+25.8 | R+33.2 | −0.8 | in | R | hit |
| OH-05 | Solid R | 1.4% | R+17.4 | R+24.9 to R+10.0 | R+11.7 | −5.7 | in | R | hit |
| OH-06 | Solid R | 0.8% | R+26.9 | R+34.5 to R+19.2 | R+20.8 | −6.1 | in | R | hit |
| OH-07 | Lean D | 72.8% | D+2.9 | R+3.4 to D+9.2 | D+9.9 | −6.9 | out | D | hit |
| OH-08 | Likely R | 4.3% | R+10.4 | R+17.8 to R+3.0 | R+4.3 | −6.1 | in | R | hit |
| OH-09 | Tilt D | 62.2% | D+1.6 | R+5.1 to D+8.2 | D+5.5 | −3.9 | in | D | hit |
| OH-10 | Lean R | 25.9% | R+3.4 | R+10.2 to D+3.4 | D+1.6 | −5.0 | in | D | miss |
| OH-11 | Solid D | 99.9% | D+57.7 | D+46.9 to D+68.4 | D+67.1 | −9.4 | in | D | hit |
| OH-12 | Solid R | 1.0% | R+22.9 | R+30.4 to R+15.5 | R+18.8 | −4.2 | in | R | hit |
| OH-13 | Solid D | 97.4% | D+12.6 | D+5.2 to D+20.1 | D+21.6 | −8.9 | out | D | hit |
| OH-14 | Solid R | 2.0% | R+14.5 | R+21.9 to R+7.1 | R+10.1 | −4.4 | in | R | hit |
| OH-15 | Lean R | 28.1% | R+3.1 | R+10.1 to D+4.0 | D+6.6 | −9.7 | out | D | miss |
| OK-01 | Solid R | 2.3% | R+14.1 | R+22.3 to R+6.0 | R+4.6 | −9.5 | out | R | hit |
| OK-02 | Solid R | 0.2% | R+43.2 | R+52.2 to R+34.3 | R+39.0 | −4.2 | in | R | hit |
| OK-03 | Solid R | 0.4% | R+37.8 | R+46.4 to R+29.2 | R+27.9 | −9.9 | out | R | hit |
| OK-04 | Solid R | 0.7% | R+27.2 | R+34.7 to R+19.7 | R+18.1 | −9.1 | out | R | hit |
| OK-05 | Likely R | 3.6% | R+10.5 | R+17.5 to R+3.5 | R+1.3 | −9.3 | out | R | hit |
| OR-01 | Solid D | 99.8% | D+44.4 | D+35.2 to D+53.6 | D+42.6 | +1.9 | in | D | hit |
| OR-02 | Solid R | 1.3% | R+18.8 | R+26.1 to R+11.5 | R+23.1 | +4.2 | in | R | hit |
| OR-03 | Solid D | 99.9% | D+48.3 | D+38.8 to D+57.8 | D+54.9 | −6.7 | in | D | hit |
| OR-04 | Solid D | 98.9% | D+19.8 | D+12.7 to D+26.9 | D+10.8 | +9.0 | out | D | hit |
| OR-05 | Solid D | 98.6% | D+16.6 | D+9.4 to D+23.8 | D+9.8 | +6.8 | in | D | hit |
| OR-06 | Solid D | 98.8% | D+19.7 | D+12.3 to D+27.0 | D+16.7 | +2.9 | in | D | hit |
| PA-01 | Tilt R | 34.0% | R+2.1 | R+8.5 to D+4.4 | D+5.7 | −7.8 | out | D | miss |
| PA-02 | Solid D | 99.8% | D+43.7 | D+34.5 to D+52.9 | D+61.7 | −18.0 | out | D | hit |
| PA-03 | Solid D | 100.0% | n/a | n/a | n/a | n/a | D | not scored | |
| PA-04 | Solid D | 99.1% | D+25.1 | D+17.6 to D+32.6 | D+34.4 | −9.2 | out | D | hit |
| PA-05 | Solid D | 99.6% | D+35.8 | D+27.3 to D+44.2 | D+44.4 | −8.6 | out | D | hit |
| PA-06 | Solid D | 98.9% | D+21.0 | D+13.5 to D+28.4 | D+29.0 | −8.0 | out | D | hit |
| PA-07 | Lean D | 80.0% | D+4.3 | R+2.3 to D+10.8 | D+12.4 | −8.1 | out | D | hit |
| PA-08 | Tilt D | 66.1% | D+2.1 | R+4.5 to D+8.7 | D+9.0 | −6.8 | out | D | hit |
| PA-09 | Solid R | 0.7% | R+28.7 | R+36.5 to R+20.9 | R+22.9 | −5.8 | in | R | hit |
| PA-10 | Tilt D | 61.3% | D+1.4 | R+5.1 to D+8.0 | D+10.4 | −8.9 | out | D | hit |
| PA-11 | Solid R | 1.8% | R+15.2 | R+22.6 to R+7.7 | R+10.8 | −4.4 | in | R | hit |
| PA-12 | Solid D | 99.1% | D+24.8 | D+17.4 to D+32.3 | D+31.3 | −6.4 | in | D | hit |
| PA-13 | Solid R | 0.4% | R+35.2 | R+43.6 to R+26.9 | R+34.9 | −0.4 | in | R | hit |
| PA-14 | Solid R | 1.0% | R+23.6 | R+31.1 to R+16.2 | R+15.0 | −8.6 | out | R | hit |
| PA-15 | Solid R | 0.6% | R+29.4 | R+37.3 to R+21.6 | R+27.6 | −1.9 | in | R | hit |
| PA-16 | Solid R | 1.6% | R+16.4 | R+23.8 to R+8.9 | R+7.7 | −8.7 | out | R | hit |
| PA-17 | Solid D | 98.5% | D+16.4 | D+9.0 to D+23.9 | D+25.8 | −9.4 | out | D | hit |
| RI-01 | Solid D | 99.3% | D+28.8 | D+21.6 to D+35.9 | D+41.1 | −12.4 | out | D | hit |
| RI-02 | Solid D | 98.6% | D+17.4 | D+10.5 to D+24.2 | D+24.1 | −6.7 | in | D | hit |
| SC-01 | Lean R | 29.7% | R+3.0 | R+10.6 to D+4.5 | D+1.0 | −4.1 | in | D | miss |
| SC-02 | Likely R | 4.2% | R+10.6 | R+18.0 to R+3.2 | R+1.0 | −9.6 | out | R | hit |
| SC-03 | Solid R | 0.4% | R+34.3 | R+42.5 to R+26.1 | R+29.3 | −5.0 | in | R | hit |
| SC-04 | Solid R | 1.6% | R+16.3 | R+23.5 to R+9.0 | R+6.1 | −10.2 | out | R | hit |
| SC-05 | Solid R | 2.5% | R+14.3 | R+22.7 to R+5.9 | R+5.7 | −8.6 | out | R | hit |
| SC-06 | Solid D | 99.4% | D+28.6 | D+20.9 to D+36.3 | D+38.7 | −10.2 | out | D | hit |
| SC-07 | Solid R | 1.5% | R+16.3 | R+23.6 to R+9.1 | R+13.5 | −2.8 | in | R | hit |
| SD-AL | Solid R | 1.1% | R+21.5 | R+29.5 to R+13.6 | R+28.0 | +6.5 | in | R | hit |
| TN-01 | Solid R | 0.1% | R+47.7 | R+57.3 to R+38.2 | R+30.8 | −17.0 | out | R | hit |
| TN-02 | Solid R | 0.8% | R+27.1 | R+34.8 to R+19.5 | R+16.6 | −10.6 | out | R | hit |
| TN-03 | Solid R | 0.8% | R+28.2 | R+35.9 to R+20.6 | R+17.4 | −10.8 | out | R | hit |
| TN-04 | Solid R | 1.3% | R+18.0 | R+25.2 to R+10.8 | D+0.1 | −18.1 | out | D leads | miss |
| TN-05 | Likely R | 4.4% | R+10.9 | R+18.8 to R+3.0 | R+4.9 | −6.0 | in | R | hit |
| TN-06 | Solid R | 1.6% | R+17.4 | R+25.9 to R+9.0 | R+3.3 | −14.2 | out | R | hit |
| TN-07 | Solid R | 1.5% | R+16.9 | R+24.2 to R+9.6 | R+2.2 | −14.7 | out | R | hit |
| TN-08 | Solid R | 1.8% | R+15.0 | R+22.3 to R+7.7 | R+5.3 | −9.7 | out | R | hit |
| TN-09 | Likely R | 6.4% | R+9.7 | R+17.7 to R+1.7 | R+1.1 | −8.6 | out | R | hit |
| TX-01 | Solid R | 0.3% | R+39.7 | R+48.5 to R+30.9 | R+38.1 | −1.6 | in | R | hit |
| TX-02 | Solid R | 3.1% | R+12.8 | R+20.9 to R+4.6 | R+2.0 | −10.8 | out | R | hit |
| TX-03 | Solid R | 1.4% | R+17.7 | R+25.1 to R+10.4 | R+5.5 | −12.3 | out | R | hit |
| TX-04 | Solid R | 1.3% | R+18.5 | R+25.9 to R+11.1 | R+12.1 | −6.4 | in | R | hit |
| TX-05 | Solid R | 1.9% | R+14.7 | R+22.0 to R+7.3 | R+2.9 | −11.7 | out | R | hit |
| TX-06 | Solid R | 1.2% | R+19.9 | R+27.4 to R+12.5 | R+4.3 | −15.6 | out | R | hit |
| TX-07 | Solid D | 99.5% | D+32.0 | D+23.9 to D+40.1 | D+43.3 | −11.3 | out | D | hit |
| TX-08 | Solid R | 1.7% | R+16.8 | R+25.2 to R+8.3 | R+6.4 | −10.4 | out | R | hit |
| TX-09 | Lean R | 15.7% | R+5.9 | R+13.5 to D+1.7 | D+15.1 | −21.0 | out | D | miss |
| TX-10 | Likely R | 4.6% | R+10.9 | R+18.8 to R+2.9 | R+7.5 | −3.3 | in | R | hit |
| TX-11 | Solid R | 0.8% | R+26.0 | R+33.5 to R+18.5 | R+19.0 | −7.0 | in | R | hit |
| TX-12 | Solid R | 1.4% | R+17.7 | R+25.1 to R+10.2 | R+6.2 | −11.4 | out | R | hit |
| TX-13 | Solid R | 0.4% | R+36.8 | R+45.3 to R+28.2 | R+30.5 | −6.3 | in | R | hit |
| TX-14 | Solid R | 1.6% | R+16.8 | R+24.2 to R+9.3 | R+8.0 | −8.8 | out | R | hit |
| TX-15 | Lean D | 73.1% | D+3.2 | R+3.5 to D+9.8 | D+24.6 | −21.5 | out | D | hit |
| TX-16 | Solid D | 99.1% | D+25.1 | D+17.6 to D+32.5 | D+41.5 | −16.5 | out | D | hit |
| TX-17 | Solid R | 1.7% | R+16.1 | R+23.5 to R+8.7 | R+7.1 | −9.0 | out | R | hit |
| TX-18 | Solid D | 99.9% | D+57.9 | D+47.1 to D+68.6 | D+72.1 | −14.2 | out | D | hit |
| TX-19 | Solid R | 0.3% | R+38.2 | R+48.0 to R+28.3 | R+39.0 | +0.8 | in | R | hit |
| TX-20 | Solid D | 99.6% | D+34.9 | D+26.6 to D+43.3 | D+55.2 | −20.3 | out | D | hit |
| TX-21 | Likely R | 6.0% | R+10.4 | R+18.8 to R+2.0 | R+9.0 | −1.4 | in | R | hit |
| TX-22 | Solid R | 3.3% | R+13.0 | R+21.4 to R+4.6 | R+3.6 | −9.3 | out | R | hit |
| TX-23 | Lean R | 26.6% | R+3.7 | R+11.6 to D+4.2 | D+8.2 | −11.9 | out | D | miss |
| TX-24 | Likely R | 3.6% | R+11.2 | R+18.7 to R+3.8 | R+6.9 | −4.4 | in | R | hit |
| TX-25 | Solid R | 1.5% | R+17.2 | R+24.6 to R+9.8 | R+7.5 | −9.7 | out | R | hit |
| TX-26 | Solid R | 1.5% | R+17.2 | R+24.5 to R+9.9 | R+10.4 | −6.8 | in | R | hit |
| TX-27 | Solid R | 2.0% | R+14.8 | R+22.2 to R+7.3 | R+2.3 | −12.4 | out | R | hit |
| TX-28 | Lean D | 89.0% | D+6.8 | R+0.3 to D+13.9 | D+36.1 | −29.3 | out | D | hit |
| TX-29 | Solid D | 99.6% | D+37.0 | D+28.5 to D+45.6 | D+59.9 | −22.8 | out | D | hit |
| TX-30 | Solid D | 99.9% | D+47.0 | D+36.2 to D+57.8 | D+65.3 | −18.3 | out | D | hit |
| TX-31 | Solid R | 1.4% | R+18.0 | R+25.4 to R+10.6 | R+8.9 | −9.0 | out | R | hit |
| TX-32 | Solid R | 2.0% | R+15.5 | R+23.9 to R+7.1 | R+2.9 | −12.6 | out | R | hit |
| TX-33 | Solid D | 99.8% | D+42.7 | D+32.3 to D+53.0 | D+57.1 | −14.5 | out | D | hit |
| TX-34 | Lean D | 78.8% | D+4.2 | R+2.5 to D+10.9 | D+16.0 | −11.9 | out | D | hit |
| TX-35 | Tilt R | 48.7% | R+0.2 | R+7.8 to D+7.4 | D+10.9 | −11.0 | out | D | miss |
| TX-36 | Solid R | 1.6% | R+16.3 | R+23.7 to R+8.8 | R+7.1 | −9.1 | out | R | hit |
| TX-37 | Solid D | 99.9% | D+55.0 | D+43.2 to D+66.9 | D+67.5 | −12.5 | out | D | hit |
| TX-38 | Likely R | 4.0% | R+12.0 | R+20.4 to R+3.5 | R+4.2 | −7.7 | in | R | hit |
| UT-01 | Solid D | 99.5% | D+32.1 | D+23.3 to D+40.8 | D+43.9 | −11.8 | out | D | hit |
| UT-02 | Likely R | 9.5% | R+7.5 | R+14.9 to R+0.2 | R+7.4 | −0.2 | in | R | hit |
| UT-03 | Solid R | 0.9% | R+24.0 | R+31.9 to R+16.0 | R+21.0 | −3.0 | in | R | hit |
| UT-04 | Solid R | 1.9% | R+14.7 | R+22.4 to R+7.0 | R+14.5 | −0.2 | in | R | hit |
| VA-01 | Tilt D | 50.3% | D+0.1 | R+6.5 to D+6.7 | D+2.9 | −2.9 | in | D | hit |
| VA-02 | Lean D | 68.6% | D+2.5 | R+4.3 to D+9.4 | D+9.0 | −6.4 | in | D | hit |
| VA-03 | Solid D | 99.8% | D+44.3 | D+35.0 to D+53.6 | D+49.3 | −5.0 | in | D | hit |
| VA-04 | Solid D | 99.7% | D+41.5 | D+32.5 to D+50.5 | D+46.9 | −5.4 | in | D | hit |
| VA-05 | Lean R | 17.8% | R+4.9 | R+11.8 to D+2.0 | R+1.6 | −3.4 | in | R | hit |
| VA-06 | Solid R | 1.0% | R+23.1 | R+30.2 to R+16.1 | R+10.2 | −12.9 | out | R | hit |
| VA-07 | Solid D | 98.3% | D+15.6 | D+8.2 to D+23.0 | D+22.6 | −7.0 | in | D | hit |
| VA-08 | Solid D | 99.9% | D+53.8 | D+43.6 to D+64.0 | D+61.7 | −7.9 | in | D | hit |
| VA-09 | Solid R | 0.6% | R+30.9 | R+38.9 to R+22.9 | R+30.8 | −0.0 | in | R | hit |
| VA-10 | Solid D | 98.8% | D+18.9 | D+11.5 to D+26.4 | D+25.3 | −6.4 | in | D | hit |
| VA-11 | Solid D | 99.8% | D+41.9 | D+32.9 to D+50.9 | D+50.3 | −8.4 | in | D | hit |
| VT-AL | Solid D | 99.5% | D+30.3 | D+23.5 to D+37.1 | D+34.4 | −4.0 | in | D | hit |
| WA-01 | Solid D | 99.6% | D+36.0 | D+27.5 to D+44.5 | D+35.1 | +0.9 | in | D | hit |
| WA-02 | Solid D | 99.5% | D+34.2 | D+25.9 to D+42.5 | D+33.5 | +0.7 | in | D | hit |
| WA-03 | Tilt D | 62.5% | D+1.7 | R+5.1 to D+8.4 | D+8.3 | −6.6 | in | D | hit |
| WA-04 | Likely R | 8.8% | R+9.0 | R+17.4 to R+0.5 | R+8.1 | −0.9 | in | R | hit |
| WA-05 | Lean R | 12.5% | R+6.5 | R+13.9 to D+0.8 | R+4.4 | −2.1 | in | R leads | hit |
| WA-06 | Solid D | 99.2% | D+27.0 | D+19.3 to D+34.6 | D+25.3 | +1.7 | in | D | hit |
| WA-07 | Solid D | 100.0% | D+74.4 | D+61.4 to D+87.3 | D+75.5 | −1.1 | in | D | hit |
| WA-08 | Solid D | 98.7% | D+18.4 | D+11.0 to D+25.9 | D+14.2 | +4.2 | in | D | hit |
| WA-09 | Solid D | 99.9% | D+48.9 | D+39.1 to D+58.7 | D+51.9 | −3.0 | in | D | hit |
| WA-10 | Solid D | 99.2% | D+27.6 | D+19.9 to D+35.3 | D+28.3 | −0.6 | in | D | hit |
| WI-01 | Tilt R | 35.1% | R+2.0 | R+8.8 to D+4.8 | D+3.9 | −5.9 | in | D | miss |
| WI-02 | Solid D | 100.0% | n/a | n/a | n/a | n/a | D | not scored | |
| WI-03 | Tilt D | 55.9% | D+0.8 | R+6.4 to D+8.0 | D+6.6 | −5.8 | in | D | hit |
| WI-04 | Solid D | 99.9% | D+54.3 | D+44.0 to D+64.5 | D+62.5 | −8.2 | in | D | hit |
| WI-05 | Solid R | 1.5% | R+16.9 | R+24.3 to R+9.4 | R+18.1 | +1.2 | in | R | hit |
| WI-06 | Solid R | 2.1% | R+13.9 | R+21.2 to R+6.5 | R+9.4 | −4.4 | in | R | hit |
| WI-07 | Solid R | 3.4% | R+13.1 | R+21.6 to R+4.6 | R+13.8 | +0.7 | in | R | hit |
| WI-08 | Likely R | 6.3% | R+9.0 | R+16.4 to R+1.6 | R+7.8 | −1.2 | in | R | hit |
| WV-01 | Solid R | 0.4% | R+34.7 | R+42.7 to R+26.6 | R+17.4 | −17.2 | out | R | hit |
| WV-02 | Solid R | 0.5% | R+33.3 | R+41.5 to R+25.2 | R+18.7 | −14.6 | out | R | hit |
| WY-AL | Solid R | 0.5% | R+31.8 | R+40.5 to R+23.1 | R+20.7 | −11.0 | out | R | hit |
Appendix B. Reproducibility
All scripts are in scripts/postmortem/report/ on branch analysis/postmortem-2026. They read the model code and the first postmortem's loaders and write only under docs/postmortem-2026/report/.
| Step | Script | Writes |
|---|---|---|
| Data layer, pinned results | rdata.py, mdl.py, metrics.py | export of results commit to a local cache |
| Scores against other forecasters | a01_score.py | data/score.json |
| Baselines | a02_baselines.py | data/baselines.json, data/baseline_rows.csv |
| Component ablations | a03_ablate.py | data/ablation.json, data/ablation_2026.csv, data/ablation_past_cycles.csv |
| Anatomy, intervals, seats, strengths | a04_anatomy.py | data/anatomy.json, data/per_race.csv |
| Trajectory and movement | a05_trajectory.py | data/trajectory.json, two CSV files |
| Joint draws and independence counterfactual | a06_uncertainty.py | data/uncertainty.json |
| Cost of each failure | a07_costs.py | data/costs.json |
| Market blend and poll errors | a08_markets_polls.py | data/markets_polls.json |
| Figures | figures.py, style.py, fonts.py | figures/fig-*.png |
| Text and PDF | build.py, report.tmpl.md | report.md, the PDF |
To rebuild on a later results commit, set RESULTS_COMMIT in rdata.py, then run the scripts in the order above with the environment in requirements.txt:
cd scripts/postmortem/report
python -m venv .venv && .venv/bin/pip install -r requirements.txt
for s in a01_score a02_baselines a03_ablate a04_anatomy a05_trajectory a06_uncertainty a07_costs a08_markets_polls figures build; do .venv/bin/python $s.py; done
Pinned inputs:
- Forecast: edition
ctm-2.2-20261103-4b0dfb7f0237onorigin/forecast-data, and the 17:09 UTC API capture of it in the forecaster-review workspace. - Results:
origin/forecast-datacommit89c2edda031e60517a2e13b865e70dfc9fef8c4f(2026-11-13T22:39:23Z). - Market panel at the freeze: commit
f4e842624102363a383950436a5aaa814dfaf6fd. - Other forecasters:
~/Projects/ctm-forecaster-review-2026(not a git repository; final rule: last capture before 2026-11-03 23:00 UTC). - Model code:
scripts/model/ctmm2at the branch head, variantexpert_free_22, run date 2026-11-03, generic ballot 8.3177. - First postmortem: commits
b50db380ed(scorecard),930a6eedb2(diagnosis and fixes),63cbe7b87bandd104331179(backtest protocol and results).
Seeds: bootstrap intervals use seed 20261103 with 10,000 resamples. The chamber-control simulation in the ablations uses seeds 20261103 to 20261122, 20,000 draws each, identical for the reference and every ablation. The one-factor shared fraction is calibrated to the published seat standard deviation (0.462 for the House, 0.722 for the Senate).
Figures use the site's own typefaces and party colors. Blue and red appear only where a mark means a party or the partisan direction of an error. The two other series colors were checked for color-vision separation with the palette validator of the charting guidelines.
Appendix C. Supplementary tables
Table C1. Sources: the race sets each is ranked in, the capture used, and the source's own last-update stamp as recorded in the capture.
| Source | Common race sets it is ranked in | Final capture (UTC) | Source's own last-update stamp |
|---|---|---|---|
| 50+1 | Senate, House | 2026-11-03T22:38Z | 2026-11-03T05:53:08Z |
| DDHQ | Senate, Governor, House | 2026-11-03T22:38Z | 2026-11-03 16:45:54 UTC |
| ElectIt | Senate | 2026-11-03T22:38Z | 2026-11-03T03:15:46Z |
| Midterm Forecast | Senate, Governor | 2026-11-03T22:38Z | Model run Nov 3, 1:39 PM ET |
| On Point Politics | Senate, Governor, House | 2026-11-03T22:38Z | updated November 3, 2026 |
| Poliwave | chamber odds or partial race coverage only | 2026-11-03T22:38Z | polls through 2026-11-02 |
| Race to the WH | Senate, Governor, House | 2026-11-03T22:38Z | Last Updated on Nov 3, 2:36 PM ET |
| Rametta & Hare | Senate | 2026-11-03T22:38Z | 2026-11-03 04:29:00.980022 |
| Silver Bulletin | Senate, Governor, House | 2026-11-03T22:38Z | 23:25:47 2 Nov 2026 |
| Split Ticket | Senate, House | 2026-11-03T22:38Z | not stated on page |
| VoteHub Complete | Senate, Governor, House | 2026-11-03T22:39Z | 2026-11-03T12:55:36.079982Z |
| VoteHub Legacy | Senate, Governor, House | 2026-11-03T22:39Z | 2026-11-03T12:55:36.079982Z |
Table C2. Mean signed margin error by state, ours and the mean of the other models (all-vote points; negative means too Republican), sorted by our error.
| State | Races | Our mean error | Field mean error | Gap | State | Races | Our mean error | Field mean error | Gap |
|---|---|---|---|---|---|---|---|---|---|
| WV | 3 | −15.3 | −14.3 | −1.0 | HI | 3 | −5.7 | −4.3 | −1.4 |
| IN | 9 | −13.7 | −12.5 | −1.2 | VA | 12 | −5.5 | −4.0 | −1.5 |
| TN | 11 | −12.4 | −11.3 | −1.1 | CO | 10 | −5.3 | −3.2 | −2.1 |
| TX | 40 | −11.4 | −9.5 | −1.8 | FL | 29 | −4.8 | −3.4 | −1.4 |
| MS | 4 | −11.0 | −8.2 | −2.8 | NY | 27 | −4.6 | −2.4 | −2.2 |
| AL | 9 | −10.5 | −10.3 | −0.2 | IA | 6 | −4.0 | −3.6 | −0.4 |
| NV | 5 | −10.4 | −8.5 | −1.9 | KS | 6 | −4.0 | −3.4 | −0.6 |
| NJ | 12 | −10.1 | −8.9 | −1.2 | UT | 4 | −3.8 | −11.3 | +7.5 |
| NC | 15 | −9.9 | −8.4 | −1.5 | MI | 15 | −3.7 | −1.0 | −2.6 |
| LA | 3 | −9.8 | −5.8 | −4.0 | WI | 8 | −3.6 | −2.7 | −0.9 |
| RI | 3 | −8.6 | −6.0 | −2.5 | AR | 6 | −3.5 | −4.8 | +1.2 |
| NM | 5 | −8.2 | −5.1 | −3.1 | MD | 9 | −3.4 | −1.5 | −1.8 |
| KY | 7 | −8.1 | −7.9 | −0.2 | ME | 3 | −2.3 | −1.1 | −1.3 |
| MO | 8 | −7.8 | −8.1 | +0.3 | MN | 10 | −1.6 | −0.4 | −1.2 |
| SC | 9 | −7.5 | −6.4 | −1.1 | CT | 6 | −1.2 | +0.7 | −1.9 |
| IL | 19 | −7.2 | −4.9 | −2.2 | MA | 7 | −1.0 | +0.6 | −1.6 |
| PA | 17 | −7.1 | −5.8 | −1.2 | VT | 2 | −0.8 | +1.7 | −2.6 |
| OK | 7 | −7.1 | −8.3 | +1.3 | WA | 10 | −0.7 | +0.8 | −1.5 |
| CA | 43 | −6.8 | −3.4 | −3.4 | NE | 4 | +0.5 | +0.3 | +0.2 |
| ND | 1 | −6.8 | −7.4 | +0.6 | DE | 2 | +0.7 | +0.1 | +0.7 |
| AZ | 9 | −6.6 | −4.8 | −1.8 | ID | 2 | +1.1 | −3.5 | +4.6 |
| WY | 2 | −6.6 | −11.7 | +5.1 | OR | 8 | +2.2 | +5.2 | −2.9 |
| NH | 4 | −6.2 | −3.8 | −2.4 | MT | 2 | +2.7 | −0.3 | +3.0 |
| OH | 17 | −5.9 | −5.4 | −0.6 | SD | 2 | +5.6 | +7.7 | −2.1 |
| GA | 16 | −5.8 | −6.2 | +0.4 |
Download the report (PDF)54 pages, 3.0 MBBack to the report’s contents